Application Monitoring (our 4 pillars)
Learn how Sentry helps developers monitor and debug errors.


The latest News and Information on Monitoring for Websites, Applications, APIs, Infrastructure, and other technologies.
iPod to iPhone. Breaking Bad to Better Call Saul. Super Mario to Mario Maker. Leaders don’t rest on their laurels. That’s what motivated us to create Performance, our new code monitoring offering: to build off our core functionality and toward the demands developers face, both today and in the future.
Reacting to alerts can be a pain, however, there are ways to be proactive and decrease frustration concerning IT Alerting. Developing an alerting strategy saves IT Operations and Development teams time, money, and eliminates notifications from low priority alerts. Keep reading for more information on routing and escalation chains, fielding alerts, and how to communicate an alerting strategy to management.
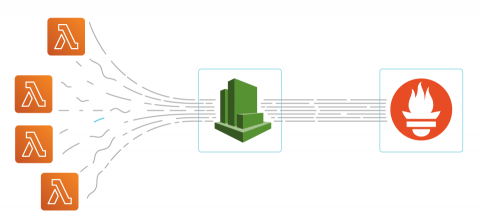
In this post, we will show how it’s easily possible to monitor AWS Lambda with Sysdig Monitor. By leveraging existing Prometheus ingestion with Sysdig, you will be able to monitor serverless services with a single-pane-of-glass approach, giving you the confidence to run these services in production.
Prometheus is a CNCF graduated project for monitoring and alerting. It is one of the most widely used monitoring and alerting tools in the Kubernetes ecosystem. Rancher users can leverage Prometheus quickly by using the built-in monitoring stack. Prometheus stores its metrics as a time series database on the local disk. Prometheus local storage is limited by the size of the disk and amount of metrics it can retain.