Operations | Monitoring | ITSM | DevOps | Cloud

How to easily retrieve values from a range in Grafana using a stat panel

Grafana is an open source visualization and monitoring solution for correlating and analyzing data from various sources. From time series graphs to heatmaps to 3D charts, it gives you lots of ways to untangle complex datasets. And while that’s incredibly powerful for observability, sometimes you’re looking for something fairly straightforward.

Reproducing and testing distributed system failures with xk6-disruptor

Distributed systems, such as modern microservices-based applications, are highly scalable, but also highly complex. Dependencies and unexpected interactions between services are a common cause of incidents, and these incidents are also notoriously hard to test for. xk6-disruptor — an extension that adds fault injection capabilities to Grafana k6, the open source reliability and load testing tool — can help overcome these challenges.

Grafana and Graphite Best Practices

Efficient monitoring and visualization of performance metrics are paramount for ensuring seamless user experiences and reliable system operations. Grafana and Graphite, two powerful open-source tools, form an unbeatable combination when it comes to monitoring and analyzing time-series data. Grafana provides a robust and flexible platform for visualizing data, while Graphite acts as a scalable and efficient backend for storing and retrieving metric data.

Visualizing MongoDB with Grafana Cloud

Learn to connect your MongoDB data and other data sources to a single dashboard to provide impactful insights into your business and improve visibility across teams. Vijay Tolani will demonstrate how to translate and transform your existing application and business metrics into flexible and versatile charts within dashboards using a wide array of visualizations, such as panels, bar gauges, geomaps, and more. Also query and alert on MongoDB and MongoDB Atlas data in real time without having to migrate or ingest it.

Grafana Labs' new AI-powered chatbot

Got questions about Grafana? Just ask Grot, Grafana's new AI-powered chatbot (still in beta). Built in partnership with Pal, a company that creates AI assistants for businesses, and inspired by our bulbous dino mascot, Grot the chatbot has been trained with large language models (LLM) on Grafana Labs’ own content. It can help you easily answer just about any question about our Grafana LGTM Stack, our open and composable hosted Grafana Cloud platform, and more — regardless of how narrow or broad the query might be or what language is set in your browser.

Complete Guide To Grafana Dashboards

Grafana is one of the most popular dashboarding and visualization tools for metrics. The Grafana Dashboards are a very important part of infrastructure and application instrumentation. In this post, we will deep dive into Grafana dashboards. We will create a Grafana dashboard for a VM’s most important metrics, learn to create advanced dashboards with filters for multiple instance metrics, import and export dashboards, learn to refresh intervals in dashboards and learn about plugins.

Send Lambda traces to Grafana Cloud with OpenTelemetry

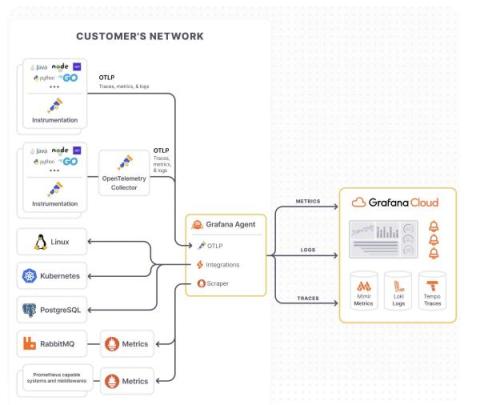
AWS’s serverless technologies are popular because they provide cost effective scaling and great separation of concerns. However, observing serverless architectures like Lambda is challenging due to their transient nature and abstracted infrastructure. Unlike traditional systems with consistent hosts, serverless functions are ephemeral, often scaling rapidly and operating in isolation.