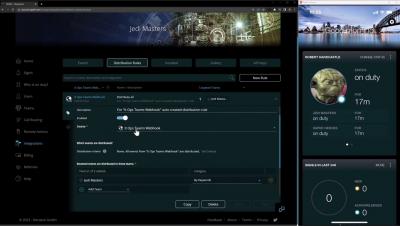
The Integrations Hub
Introducing the new SIGNL4 Integration Hub. This video gives a quick tutorial of the new Signl4 Integration Hub and a description of its features and a walkthrough of how to use the Integration Hub with Signl4.


Alert fatigue is a serious issue that affects numerous professions, especially in the IT industry. It can lead to neglecting critical events and delaying response times. IT teams need to continuously monitor their systems and applications to avert possible downtime and keep operations running smoothly. However a high number of incoming alerts inundating these teams can make them less responsive. The ramifications of such disregard can severely affect the efficiency and dependability of IT teams.
Grafana 9.5 has arrived! 🔥🎉 Get Grafana 9.5 The latest Grafana release introduces new features and improvements, such as major Grafana Alerting improvements, dashboard and visualization enhancements, a redesigned navigation experience, support bundles for faster issue resolution, and much more to provide you with better insights into your data.
When your alerts cover systems owned by different teams, who should be on call? We get this question a lot when talking about SLOs. We believe that great SLOs measure things that are close to the user experience. However, it becomes difficult to set up alerting on that SLO, because in any sufficiently complex system, the SLO is going to measure the interaction between multiple services owned by different teams.
Monitoring tools, also known as observability solutions, are designed to track the status of critical IT applications, networks, infrastructures, websites and more. The best IT monitoring tools quickly detect problems in resources and alert the right respondents to resolve critical issues. Response teams use observability solutions to gain real-time insights into resource availability, stability and performance.
IT incidents are events which lead to a disruption or deviation from the regular operating standards of a computer system or network. They can be caused by various factors, including hardware or software failures, human error, or even deliberate external (cybersecurity) attacks. It begins with short delays, or services cutting out - for example, when a website or server is down, or access to data(bases) takes too long.