The latest News and Information on Monitoring for Websites, Applications, APIs, Infrastructure, and other technologies.
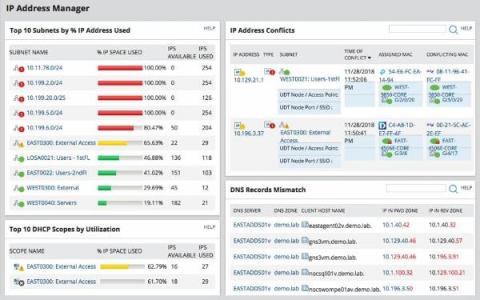
In recent months, we’ve talked a lot about how AppNeta by Broadcom offers active monitoring capabilities, and how they enable teams to rapidly troubleshoot issues across both internally managed networks and those managed by third parties, such as ISPs and cloud providers.
Grafana is an open source visualization and monitoring solution for correlating and analyzing data from various sources. From time series graphs to heatmaps to 3D charts, it gives you lots of ways to untangle complex datasets. And while that’s incredibly powerful for observability, sometimes you’re looking for something fairly straightforward.
Organizations are moving to micro-services and container-based architectures because these modern environments enable speed, efficiency, availability, and the power to innovate and scale more quickly. However, when it comes to troubleshooting distributed cloud native applications, teams face a unique set of challenges due to the dynamic and decentralized nature of these systems.
With our plans for InfluxDB 3.0 OSS laid out, both myself and the rest of the DevRel team have been actively searching for ecosystem platforms that would be logical integrations for the future of InfluxDB. One of these platforms is Quix! Quix is a comprehensive solution tailored for crafting, launching, and overseeing event streaming applications using Python. If you’re looking to sift through time series or event data in real-time for instant decision-making, Quix is your go-to.