Operations | Monitoring | ITSM | DevOps | Cloud

The latest News and Information on Monitoring for Websites, Applications, APIs, Infrastructure, and other technologies.

Icinga User Survey 2019 Report

In late 2019 we were running our first ever user survey on Icinga. We always strive to get to know our users and their requirements better. Our goal for the survey was to get a general understanding about how Icinga is being used. The results are very interesting for us and will help us to make decisions. Today we want to share the results of the survey.

Alternative to Icinga: Pandora FMS open source

Examine. Search. Browse. Icinga, in Zulu language. The origin of the names of many software are somewhat strange (or unknown). In fact, that would be enough material for a whole different article. This time here I come to propose Pandora FMS as an alternative to Icinga and, if you are a frequent reader of ours, it may ring a bell.

How Do I View My Elasticsearch Mappings?

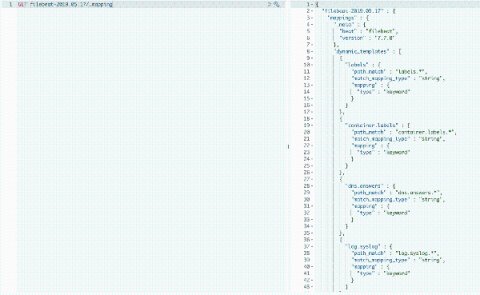
There are two ways you can view the current mappings on your Logit ELK Stacks. One way is to use dev tools in Kibana. You can access Kibana from any of your dashboards by choosing from your dashboard Stack settings > Access Kibana. You can also search for a specific mapping of an Index name. For example if we wanted to see the mappings for the a Filebeat index name we can run the following to return only the desired mappings.

InfluxDB Cloud extends to Microsoft Azure Cloud - now available on all major cloud platforms

SAN FRANCISCO — July 22, 2020 — InfluxData, creator of the time series database InfluxDB, today announced that InfluxDB Cloud is now available on Microsoft Azure, furthering the company’s commitment to increase accessibility to developers. With this announcement, InfluxDB Cloud is now live on all three major cloud platforms — Microsoft Azure, Google Cloud and Amazon Web Services.

Best practices for maintaining end-to-end tests

In Part 1, we looked at some best practices for getting started with creating effective test suites for critical application workflows. In this post, we’ll walk through best practices for making test suites easier to maintain over time, including: We’ll also show how Datadog can help you easily adhere to these best practices to keep test suites maintainable while ensuring a smooth troubleshooting experience for your team.

Loki tutorial: How to send logs from EKS with Promtail to get full visibility in Grafana

Amazon Elastic Kubernetes Service (Amazon EKS) is the fully managed Kubernetes service on AWS. If you’re using it and wondering how to query all your logs in one place, Loki is the answer. With this tutorial, you’ll learn how to set up Promtail on EKS to get full visibility into your cluster logs while using Grafana. We’ll start by forwarding pods logs then nodes services and finally Kubernetes events.