Operations | Monitoring | ITSM | DevOps | Cloud

How we're improving backfill methods to get older data into Prometheus

A few weeks ago, I teamed up with Bartek Plotka, a principal software engineer at Red Hat, for a deep-dive session on Prometheus at KubeCon + CloudNativeCon EU. We covered a lot of topics, with highlights that included scaling Prometheus, remote-write and metadata. We ended the talk with a quick demo on how to import data from CSV files into Prometheus. I want to use this blog post to provide more insight into the state of backfill in Prometheus.

KubeCon + CloudNativeCon EU recap: What you need to know about OpenMetrics

Before Prometheus, the closest thing to a common standard for metrics was Simple Network Management Protocol (SNMP), the internet standard protocol for collecting and organizing information and monitoring networks. Front and center in SNMP is ASN1, which lacks modern design and comes with trade-offs that made sense in the past but not so much today. Aside from that, many of the existing protocols were chatty and slow as well as proprietary, very hard to implement, or both.

Bold, insightful, real-time: Visualizing APM data with Canvas in Kibana

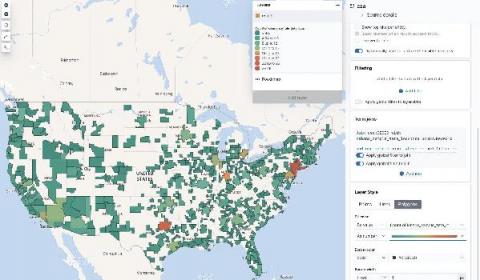
Since we launched Canvas in 2018, we have seen tons of our users create beautiful dashboards that tell stories with Elasticsearch data. In the spirit of making it even easier to get started, we are creating templates that you can import and get instantly beautiful dashboards for all the data the Elastic Stack captures.

Customize your Enterprise Alert dashboard

There is nothing more frustrating for IT Professionals than having to go to multiple places and sometimes into multiple systems to track down an issue. Yes, it is the job, but with Enterprise Alert, we provide a single pane of glass that contains all events, policies, and alert notifications in one place. The next question we asked is, “Is all of the relevant data easily accessible, and can it be viewed from one central screen”?

Monitoring your own infrastructure with open-source Graphite and Grafana

An infrastructure, especially if it is scalable, can become extremely complex to visualize and observe. If something goes wrong, it would be difficult to fully understand the problem without a great data monitoring strategy. Information related to CPU, RAM, and statistics about SSH or HTTP servers are critical to understanding the performance of your web-application.

Popular community plugins that can improve your Grafana dashboards

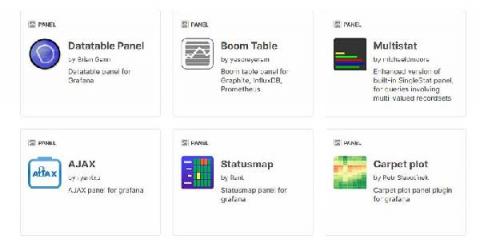
One thing we believe at Grafana Labs is that your data should be presented in a way that makes sense to you. Since the release of Grafana v7.0, we’ve seen a lot more developers taking advantage of the new plugins platform, which helps them build high-quality custom plugins faster than ever.

Open Source Grafana Tutorial: Getting Started

Open source grafana is one of the most popular OSS UI for metrics and infrastructure monitoring today. Capable of ingesting metrics from the most popular time series databases, it’s an indispensable tool in modern DevOps. This OSS grafana tutorial will go over installation, configuration, queries, and initial metrics shipping. Open source grafana is the equivalent of what Kibana is for logs (for more, see Grafana vs. Kibana).

3 tips to improve your Grafana dashboard design

Every Grafana user is a dashboard designer. The Grafana community gladly shares their dashboards, so there’s tons of inspiration available. Chances are you’ve downloaded some community dashboards and tweaked them in search of patterns that work for you. But if you haven’t found them, you’re not alone! In my Aug. 27 webinar, “A beginner’s guide to dashboard design,” I’ll cover the basics of good dashboard design.