Operations | Monitoring | ITSM | DevOps | Cloud

How blocks storage in Cortex reduces operational complexity for running Prometheus at massive scale

Cortex is a long-term distributed storage for Prometheus. It provides horizontal scalability, high availability, multi-tenancy and blazing fast query performances when querying high cardinality series or large time ranges. Today, there are massive Cortex clusters storing tens to hundreds of millions of active series with a 99.5 percentile query latency below 2.5s.

How we're using 'dogfooding' to serve up better alerting for Grafana Cloud

At Grafana Labs, we’re big fans of putting ourselves in the shoes of our customers. So when it comes to building a product, dogfooding is a term we throw around constantly. In short, what it means is that we actually use the products we create throughout their entire life cycle. And I really mean the whole life cycle.

What recent optimizations in the Prometheus storage engine, TSDB, will enable in the future

At the recent PromCon Online, I gave a review of developments in the space of the Prometheus storage engine, TSDB. In this blog post I am going to recap a bit of the talk and add more insights into what these developments will enable us to do in the future. While the talk contained some of the near-future features, I will be diving even further ahead. You can watch the talk here.

Announcing new Sumo Logic dashboards

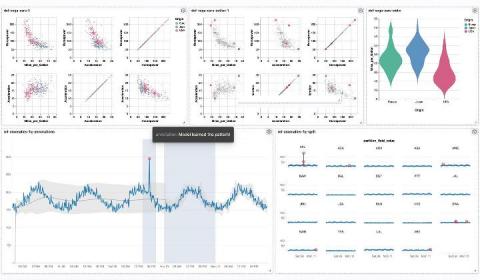
We’re excited to announce the first version release of our new dashboard framework: Dashboard (New). Built on top of a scalable, flexible, and extensible charting system, the new dashboards provide customers with deep control over their visuals, enable metadata rich workflows, and create dashboards in a dashboard first GUI.

Part One: How to Build Monitoring Dashboards based on Grafana with Logz.io

Logz.io customers use our Infrastructure Monitoring product to collect, store, and analyze metrics. In this webinar, Daniel and Noa will explain some of the basics of getting started with the product and cover some recent product additions with Grafana 7.

Introducing the new and improved New Relic plugin for Grafana

It’s been a while, but the Kelly and Regis of Grafana Labs (a.k.a. Christine and Eldin of Solutions Engineering) are back to report on another Grafana Enterprise plugin: New Relic! The latest version of this plugin will be just one of the many topics we’ll cover during today’s webinar, All about Grafana plugins: Visualizing disparate data sources in one place. We’ll be hosting a great conversation around plugin updates, use cases, and the best way to make coffee.

How the Cortex and Thanos projects collaborate to make scaling Prometheus better for all

Cortex and Thanos are two brilliant solutions to scale out Prometheus, and many companies are now running them in production at scale. These two projects, both in the CNCF Sandbox, initially started with different technical approaches and philosophies: Cortex has been designed for scalability and high performances since day zero, while Thanos was originally focused on operational simplicity and cost-effectiveness.