Operations | Monitoring | ITSM | DevOps | Cloud

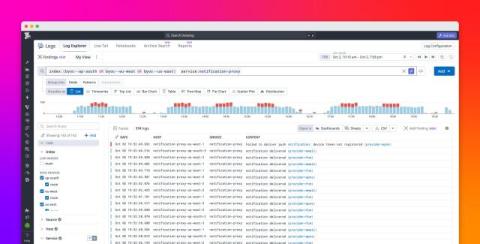
Elastic Introduces Elastic nightshift AI SRE to Investigate with the Full Context Others Can't Afford to Keep

The AI SRE uses complete context from across the entire stack to continuously detect issues and learn from every incident, delivering evidence-backed answers engineers can trust.


10 Best AI Logging Tools in 2026: Features, Pricing & Comparison

As businesses increasingly integrate artificial intelligence into their applications and workflows, understanding what happens behind the scenes of these AI systems has become essential. AI-powered chatbots, large language models (LLMs), and autonomous AI agents can process thousands of requests, interact with external applications, and execute complex tasks. However, when something goes wrong, identifying the source of the problem isn’t always straightforward. Was the AI response incorrect?

8 Best AI SRE Tools in 2026 for Incident Investigation and Reliability

The best AI SRE tools to evaluate in 2026 include Sherlocks AI, Resolve AI, Traversal, Cleric, Rootly AI SRE, Komodor Klaudia, Datadog Bits Investigation, and Dynatrace Intelligence. Each addresses a different part of reliability work, from investigating alerts across multiple systems to diagnosing Kubernetes failures or validating production changes. Choosing the right tool starts with a practical question: where does your team lose time during an incident?

Unify data across Datadog BYOC with cross-cluster queries for teams and AI agents

Organizations may need to keep data in specific regions or infrastructure they control, whether because of data residency requirements, internal policies, or transfer costs. Datadog Bring Your Own Cloud (BYOC) extends the Datadog platform into those environments. Each BYOC deployment runs as a Kubernetes cluster with its own object storage, keeping data close to its source.

Building Reliable IT Infrastructures

Downtime is expensive, and it’s getting harder to avoid. Every year, enterprise IT environments grow more distributed, dynamic, and difficult to maintain with legacy tools and manual processes. With unplanned outages costing enterprises nearly $25,000 per minute, establishing and maintaining a resilient IT infrastructure is essential. Enterprises have already invested heavily in resilient architecture.

What Is High Availability? How It Works and How Many Nines You Actually Need

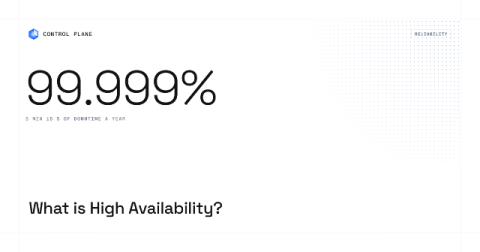
High availability (HA) is a system’s ability to keep serving users when individual components fail, from a single server up to a whole cloud region or provider. It is measured in nines: 99.9% allows about 8 hours 46 minutes of downtime a year, 99.99% about 52 minutes, and 99.999% about 5 minutes 15 seconds. HA works by removing single points of failure through redundancy, health checks, automatic failover, and replicated data.

First CloudWatch Logs on Logit.io

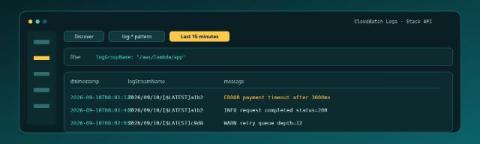
CloudWatch already holds the lines from your Lambda, ECS task, or unified agent. The first useful win on Logit.io is not a migration spreadsheet. It is one Log Group, the documented Lambda shipper posting to this stack's API, and rows in OpenSearch Dashboards Discover that show logGroupName, logStreamName, and message. If you are still proving that a Logs stack can accept anything at all, start with First Logs on Logit.io; this post assumes CloudWatch is the source and the Stack API is the pipe. Contents.

What Is RMM (Remote Monitoring and Management)?

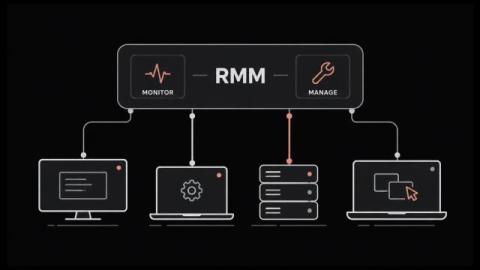
RMM lets one small team look after thousands of machines nobody will ever physically touch. It grew up inside managed service providers. The whole category runs on agent-based monitoring, which means a small program sits on every endpoint and phones home on a schedule. That agent is also why attackers have taken such an interest lately. In this blog, you'll see: By the end you'll know what the category covers and where it stops. RMM stands for remote monitoring and management.

SSL Handshake Guide Covering Each Step and the Fixes That Prevent Outages

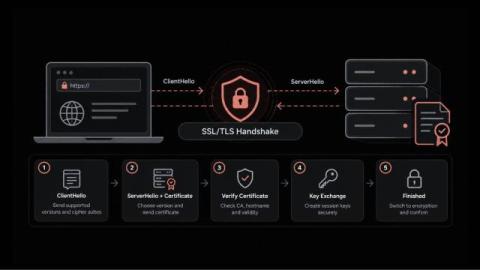
Why would a website that passes every uptime check still show customers a security warning? In most cases, the server is running and the network is healthy. The failure happens earlier, during the brief exchange in which the browser and the server agree on how to communicate securely. That moment is the SSL handshake. If it goes wrong, users get an error page while your dashboards stay green. Maybe a certificate expired; maybe a routine change left both sides on different protocol versions.