Operations | Monitoring | ITSM | DevOps | Cloud

The latest News and Information on Log Management, Log Analytics and related technologies.

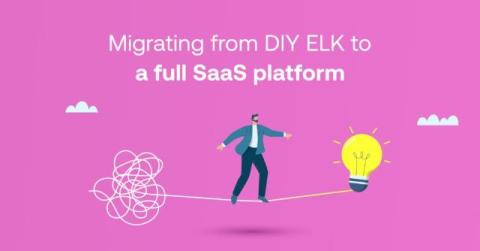
Migrating from DIY ELK to a Full SaaS platform

Managing modern systems requires a constant balance between operational efficiency and innovation; going a little further, maintaining seamless operations and delivering exceptional customer experiences increasingly depend on ensuring robust observability. For years, the ELK stack (Elasticsearch, Logstash, Kibana) has been the go-to solution for many organizations for log management and observability, offering flexibility control and an open source approach.

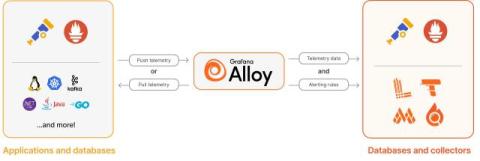
How to send OTLP or Prometheus metrics and logs to Grafana Cloud with Grafana Alloy

We introduced Grafana Alloy last year in an effort to create the best possible open source “big tent” telemetry collector. A continuation of our work on Grafana Agent Flow, we designed Alloy to simplify observability at scale and to easily integrate with the OpenTelemetry and Prometheus ecosystems. We’ve seen lots of interest since Alloy was announced at GrafanaCON 2024, and industry observers are taking notice, too.

The Best Real-Time Data Streaming Tools

For organizations, it is crucial to swiftly respond to evolving market dynamics, shifting customer preferences, and emerging operational challenges. This responsiveness is made possible through the use of real-time data streaming technologies, which provide a dynamic and profound understanding of the environment. In this article, we will outline why real-time data streaming is beneficial before listing the leading real-time data streaming tools currently available.
Sponsored Post

How Log Analytics Powers Four Essential CloudOps Use Cases

Cloud computing shapes the ability of enterprises to transform themselves and effectively compete. By renting elastic cloud resources, enterprises can support new customer platforms, distributed workforces, and back-office operations. The cross-functional discipline of CloudOps helps enterprises manage cloud resources by optimizing applications and infrastructure. But, none of this can be done without the right strategies and techniques to analyze your application telemetry data - primarily logs and events.

23 Lambda Metrics You Should Know

Developing an application is like composing a song. You know your intended outcome, and the creation is what gives you the jolt of adrenaline to keep going. However, your job isn’t over once you push the application live. You need to monitor and maintain it to ensure performance and cost optimization. AWS Lambda forwards metrics to CloudWatch once the function completes processing an event. Through the CloudWatch console, you can set alarms and build visualizations with these metrics.

The Log Monitoring Guide for Sweet Insights

Logs are more than just records. With proper log monitoring, they become the honey that sweetens observability. Observability is your ability to understand and optimize your system’s behavior. Turning raw logs into actionable insights requires the right tools, practices, and insights. This blog post is a guide on log monitoring key concepts and best practices for sweetening your observability.