The latest News and Information on Log Management, Log Analytics and related technologies.
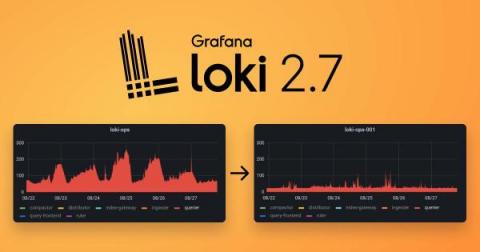
Grafana Loki 2.7 has arrived! With it comes an experimental feature we are rather excited about: a redesigned index based off of the Prometheus TSDB index. While we are still in the early stages, this enhancement in Grafana Loki, which we previewed at ObservabilityCON 2022, creates a smaller storage footprint, better query performance, and much more that we will dive into below!
When we created Cribl Search, we wanted to give systems administrators the ability to query data without having to spend resources on collection and processing first — but we didn’t stop there. With Search, we’re also making it possible to query all the data you’ve already collected, processed, and kept in places like object stores, file systems, analytics tools, S3 buckets, or other data stores.
Our product strategy this year was relatively simple. Many observability practitioners we spoke with complained that observability was oftentimes slow, heavy, complex, and costly – which can be summed up in our CEO’s recent blog on modern observability challenges. While our customers didn’t report similar challenges, we wanted to further distance ourselves from this typical observability experience.
One of the most useful features of Cribl’s flagship solution Stream is its ability to separate the wheat from the chaff in your data’s journey from source to destination — Stream allows you to control what data goes to what system, Cribl Search, takes this to the next level by controlling what data should be collected before it is ever put in motion.
Picture this! The coffee is hot, the keyboard is ready to rock, the bandwidth is unused, and the software is deployed (or the cloud is waiting patiently)…. but the data is missing! That’s right, most of us have been there. In our industry, it is very common for data to be the lowest common denominator for many projects.