The latest News and Information on Log Management, Log Analytics and related technologies.
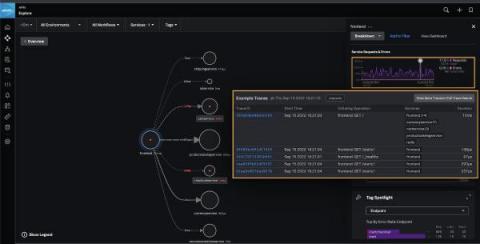
Application Performance Monitoring (APM) is great for tracking the health and performance of your software tool. APM helps you understand what's happening inside your application by monitoring various parameters such as CPU/memory stress, internal network throughput, and more. However, mixing in log analytics can take your APM game up a notch. Almost all software tools generate logs when they run.
The question isn't whether an incident will happen: it's when it will happen. Systems will crash. Software will fail. Vendors will suffer an outage of their own. It's your job to be prepared for these problems, and incident severity levels are one of the tools you need. Incidents have varying impacts on your business and customers. Incident severity levels are how you classify their impact and manage your response.
It's always interesting to hear what feature requests dashboard users share with our product team. Sometimes it's big things — such as being able to set tokens on drilldowns — and sometimes it's little things. In Splunk Cloud Platform 9.0.2208, we've included a handful of Dashboard Studio "little things" updates.
In Part I in our series outlining best practices for scaling observability, we reviewed the data analysis capabilities that can help engineers troubleshoot faster during high pressure situations during a game launch. Nobody wants lag time or crashes in their game launch. Similarly, no one wants terminated sessions or for your gamer customers to log off and play a competitor’s game.