The latest News and Information on Log Management, Log Analytics and related technologies.
Today, Logz.io is thrilled to announce that Prometheus-as-a-service is now generally available for anyone to try themselves! I’d like to thank the Logz.io village for executing a huge milestone on our quest to unify the best open source monitoring tools on Logz.io’s scalable cloud platform.
To prevent failure and minimize downtime, it’s important to make sure your infrastructure and applications are observable. But, just getting to the point of observability isn’t enough. You need to be able to use the data that comes with observability — ideally in a way that helps your team troubleshoot more quickly and minimize or prevent downtime.
Hybrid cloud architectures provide the flexibility to utilize both public and cloud environments in the same infrastructure. This enables scalability and power that is easy and cost-effective to leverage. However, an ecosystem containing components with dependencies layered across multiple clouds has its own unique challenges. Adopting a hybrid monitoring strategy doesn’t mean you need to start from scratch, but it does require a shift in focus and some additional considerations.
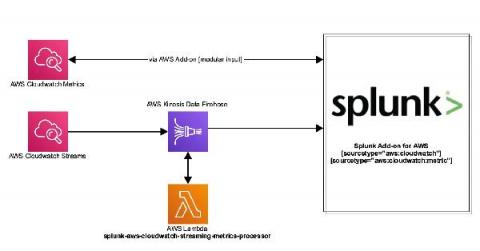
The way we ‘data’ is about to change, and Splunk’s Connect for Ethereum (aka EthLogger) is helping organizations to adapt. Splunk Connect for Ethereum enables organizations of all sizes to investigate, monitor, analyze and act upon their rapidly growing blockchain data sets across multiple chains.
Recently we announced in our blog post, "The OpenTelemetry Tracing Specification Reaches 1.0.0!," that OpenTelemetry tracing specifications reached v1.0.0 — offering long-term stability guarantees for the tracing portion of the OpenTelemetry clients. Today we’re excited to share that the first of the language-specific APIs and SDKs have reached v1.0.0 starting with OpenTelemetry Java and OpenTelemetry .NET.
As your Elastic usage increases and your use cases expand, it's important to know the benefits and cost savings that you can achieve by running Elasticsearch as a service. But since every Elasticsearch implementation can vary by use case and deployment model, it can be complicated to tackle on your own. So with that in mind, we are excited to share the Elastic Cloud Value Calculator.
Logging is a crucial part of the observability of your Java applications. Combined with metrics and traces gives full observability into the application behavior and is invaluable when troubleshooting. Logs, combined with metrics shortens the time needed to find the root cause and allows for quick and efficient resolutions of problems.