The latest News and Information on Log Management, Log Analytics and related technologies.
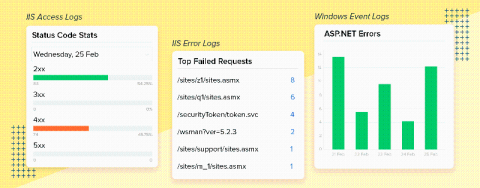
Unresponsive and slow pages are both terrible for any website. Even with the best user interface (UI), unresponsive and slow pages negatively affect the customer experience and the brand's reputation. Research from the Nielsen Norman Group has determined that the average user will leave a site after about 10 seconds of waiting for a page to load. If your page takes longer than a few seconds to load, it's time you check your IIS server logs.
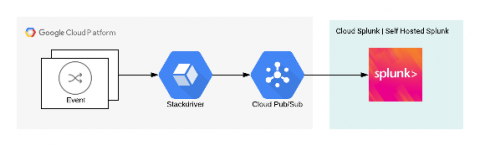
During my career (in technology), I have dealt with many clients to whom security was one of the main areas of concern. As such, there’s always room for improvement but without a shed of a doubt, communications direction and stateful firewalls are some of the very first elements to consider. When it comes to logging and audit information, as a rule of thumb, it’s good to have a log aggregator stored outside of the scope of a cloud provider. A great log correlation out there is Splunk.
All you telecom engineers out there must have already heard of fault management, right? Well, those of you who haven’t yet heard of it and need to understand what it’s about, worry no more! I’ll help you. Let’s start by defining the term.
Software monitoring allows developers and IT professionals to observe events occurring within a monitored system. The data gathered by monitoring processes offers visibility into how the monitored entity is behaving and provides warning signs indicating that some aspect of the system deserves greater attention. More and more software is migrating to the cloud, and monolithic software is being decomposed into microservices to create distributed applications.
In the previous post, we talked about connecting data sources to your Log Analytics workspace. While the data can be super useful, it is “unstructured” at this point – not really in the right shape to perform a specific task or enable useful monitoring of an application or a service. This is where “Solutions” come into picture (formerly called management solutions). Solutions can also leverage other services in Azure to perform many related actions, such as automation.
Our suite of operations products has come a long way since the acquisition of Stackdriver back in 2014. The suite has constantly evolved with significant new capabilities since then, and today we reach another important milestone with complete integration into the Google Cloud Console. We’re now saying goodbye to the Stackdriver brand, and announcing an operations suite of products, which includes Cloud Logging, Cloud Monitoring, Cloud Trace, Cloud Debugger, and Cloud Profiler.
As antivirus and machine learning-based malware detection have increased their effectiveness in detecting file-based attacks, adversaries have migrated to “living off the land” techniques to bypass modern security software. This involves executing system tools preinstalled with the operating system or commonly brought in by administrators to perform tasks like automating IT administrative tasks, running scripts on a regular basis, executing code on remote systems, and much more.
In the first part of this blog article, I introduced key concepts surrounding data ingestion for the industrial Internet of Things, the role and importance of metrics and self-services capabilities for shop floor personnel. So let's see how this looks in practice and how the knowledge of a process or control engineer can be turned into action.