Operations | Monitoring | ITSM | DevOps | Cloud

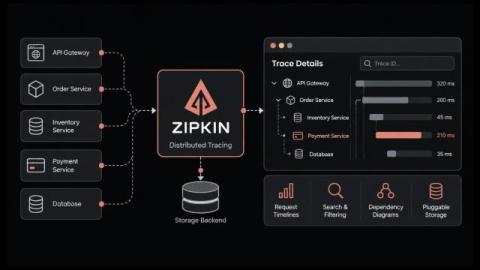
What is Zipkin and How does Distributed Tracing Speed Up Incident Resolution

If a checkout slows down or an API call fails, why can the cause stay hidden for so long while every service dashboard looks fine? One customer click in a microservices setup may hit a gateway and a few backend services first, then a queue or a database. Every hop logs its own events, yet none of those logs points back to the original request. Distributed tracing was created to solve exactly this. Zipkin arrived early, as one of the first open-source tracers.

Introducing Fine-Grained RBAC: Resource-Level Permissions in SigNoz

A quick demo of fine-grained access control in SigNoz, using dashboards as the example. We’ve built one of the most advanced access control models in the observability space. See how to define exactly who can access each individual dashboard.

We Upgraded SigNoz Infrastructure Monitoring for Deeper Visibility and Faster Troubleshooting

A quick walkthrough of the new infrastructure monitoring experience in SigNoz Cloud. We’ve made several additions to give you more visibility into your infrastructure health and help you troubleshoot faster. Here’s what’s new,

Sentry JavaScript SDK v11 adds tracing for all JS platforms

This post is about a recent change to the Sentry JavaScript SDKs. If you don’t use Sentry with JavaScript, it may still be useful as a look at how we made the change and why. In the Sentry JavaScript SDK v11, we rebuilt how our tracing integrations work. While we still support the OpenTelemetry standard (described in more detail below), we now instrument your dependencies with a code transformer instead of using the OpenTelemetry instrumentation classes as we did in previous versions.

Manage your OpenTelemetry Collectors with Fleet Management in Grafana Cloud

If you’ve built your telemetry pipelines around OpenTelemetry Collectors, you’ve already invested in a collector distribution, YAML configuration, and a deployment model that fits your infrastructure. As that deployment grows, managing it means keeping shared configuration consistent, accommodating different workloads, and understanding whether your collectors are healthy. Fleet Management in Grafana Cloud brings those tasks together in one place.

OpenTelemetry Collector Configuration for LLM Observability

Your LLM application emits telemetry unlike anything else in your stack. Model calls, tool invocations, retrieval steps, and token usage arrive as spans whose attributes carry entire prompts and completions. That data is bulky, it's full of user content you may not be allowed to export, and depending on which instrumentation each service uses, the same fact can arrive under different attribute names.

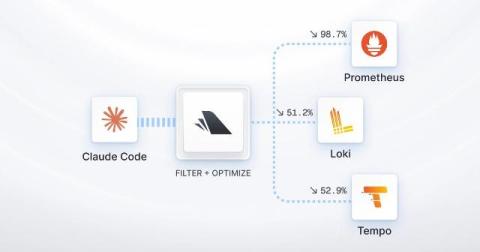
How to Filter and Reduce AI Agent Telemetry with OpenTelemetry & Bindplane

Why is the telemetry AI agents generate so intimidating? If you turn on Claude Code’s internal telemetry it’ll throw a wall of text at you. And, it’s very expensive to store. But, the bigger issue is that you can’t make sense of it. Luckily it’s all OpenTelemetry native. That means you can configure it to send, transform, and store what you really need. Which raises the only question that matters. What do you actually need?

FastAPI 0.142 Turns On OpenTelemetry by Default. Here's What It Records.

FastAPI 0.142.0 ships with OpenTelemetry built in. Install fastapi, set one environment variable, and every request produces a trace, metrics, and error logs. No middleware, no instrumentation package, no code. That’s a big change for a framework most Python teams instrument by hand. It’s also easy to misread. The defaults record more than some teams expect in one place, and less than others assume in another. Here’s what you actually get.

Distributed Tracing In Netdata: OpenTelemetry Traces

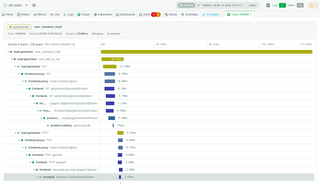
Back in 2020, when we laid out where Netdata was going, the plan listed anomaly detection, log collection and “application traces collection”. The first two shipped years ago. Traces took longer, because we wanted them to work the way the rest of Netdata works: collected and stored on your own nodes, with no separate backend to stand up. Distributed tracing is now available in Netdata.

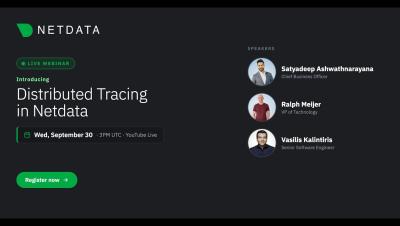
Introducing Distributed Tracing in Netdata

Netdata now supports distributed tracing. In this webinar, we'll demo the new tracing capabilities for the first time: OpenTelemetry trace ingestion, the new tracing dashboard, and the UI built to let you move from a metric anomaly to the exact span that caused it. For years, teams have asked us to close the gap between infrastructure monitoring and application performance. This release does that. Netdata can now ingest traces via OTEL, correlate them with the metrics and logs you already collect, and surface them in a purpose-built interface designed for speed and clarity.