Operations | Monitoring | ITSM | DevOps | Cloud

Top six Amazon S3 metrics to monitor

When you’re planning an application performance monitoring (APM) strategy, collecting metrics from storage services like Amazon S3 may not seem like a priority. After all, part of the point of object storage is that applications can read and write from storage buckets seamlessly, with minimal configuration and overhead. Unlike databases or file systems, storage buckets don’t require complex configurations that could lead to performance issues.
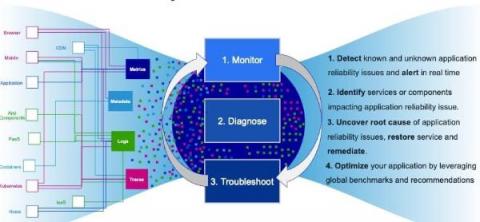
The Future of Sumo Logic Observability

I have always found data collection to be a fascinating area of work at Sumo Logic. Collecting data is a critical first step for all the solutions we develop for our customers. After all, to observe the health and performance of your applications, you must first collect all relevant data. It's also an area that has seen some significant activities by the open-source community over the years, which is completely changing the landscape of observability as we know it.

Illuminate 2021 - Embracing open standards for big picture observability

We just wrapped up a fantastic 5th Illuminate, Sumo Logic’s user conference, filled with amazing customer speakers, partners, and Sumo Logic experts all sharing their insights and expertise. The level of engagement taking place during presentations, workshops and executive meetings showed the high level of interest in open telemetry, unified analytics and full-stack observability to solve the challenges inherent in application modernization and cloud migration.

Troubleshooting Outages at 3 AM with Alert Response

Imagine you are an on-call engineer, who receives an alert at 3 AM in the morning informing you that customers are experiencing high latency on your website, and are unable to shop. Being an Incident response coordinator myself at Sumo Logic, I can tell you, I don’t envy being that engineer. If this alert fired, this is what would likely follow: The biggest challenge is how to gather this information quickly, so you can decide whether to jump out of the bed or go back to sleep.

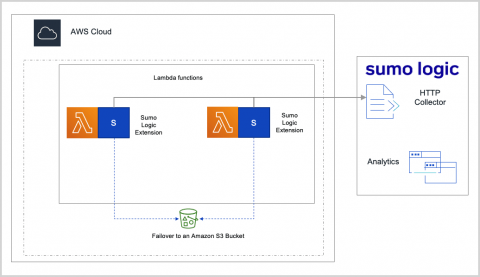
Sumo Logic Extends Monitoring for AWS Lambda Functions Powered by AWS Graviton2 Processors

Organizations are constantly trying to maintain pace with users' expectations and desires from a digital experience. These users expect an experience that constantly changes based on their preferences and behavior, which means innovating quickly and improving software is critical to user happiness and driving business success.

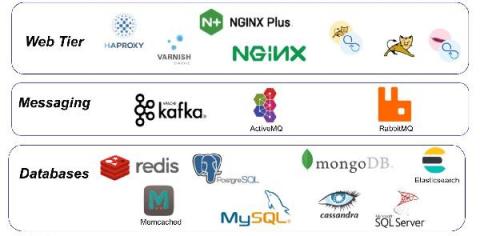
Extending Observability to App Infrastructure

We know organizations today rely on software applications to drive their digital transformation, providing customers with the tools, features and experience end-users have come to expect when doing things such as transact, work and communicate, to name a few. Ensuring a great user experience, however, means making sure the various elements making up a usable application are running smoothly and reliably.

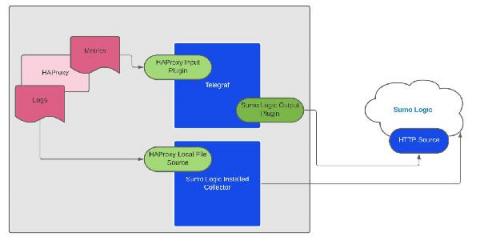
Monitoring HAProxy Logs and Metrics with Sumo Logic

HAProxy is one of the world’s most innovative and highest-performing load balancing solutions. The load balancer is critical for enabling high availability and supporting the dynamic scaling of infrastructure within modern applications. Because of its importance, engineers need tools that can quickly and effectively diagnose any problems with the load balancer if they arise.

Sumo Logic Red Hat Marketplace Operator

Red Hat OpenShift is an open source container application platform that incorporates a collection of software that enables developers the ability to run an entire Kubernetes environment. It includes streamlined workflows to help teams get to production faster and is tested with dozens of technologies while providing a robust tightly-integrated platform supported over a 9-year lifecycle.

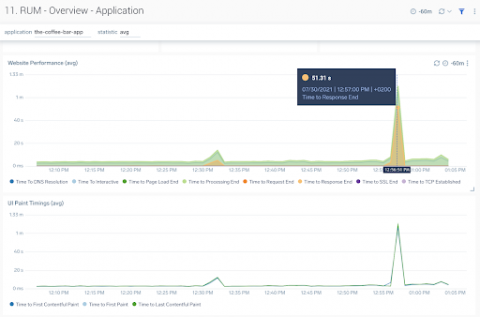
Sumo Logic completes full stack observability with Real User Monitoring capabilities

We all know how our life has changed in the last two decades in terms of how we interact with our vendors for day to day activities, regardless if we shop for a birthday present or read a newspaper. This digital transformation of everything we do increased even more during the pandemic, when it appeared that a malfunctioning digital access channel can often mean lack of possibility to enter certain places like even the country or a plane to get back home.

How to Troubleshoot Apache Cassandra Performance Using Metrics and Logs in Debugging

In the era of data abundance, there exists a significant need for database systems that can effectively manage large quantities of data. For certain types of applications, an oft-considered option is Apache Cassandra. Like any other piece of software, however, Cassandra has issues that could potentially impact performance. When this happens, it’s critical to know where to look and what to look for in the effort to quickly restore service to an acceptable level.