The latest News and Information on Monitoring for Websites, Applications, APIs, Infrastructure, and other technologies.
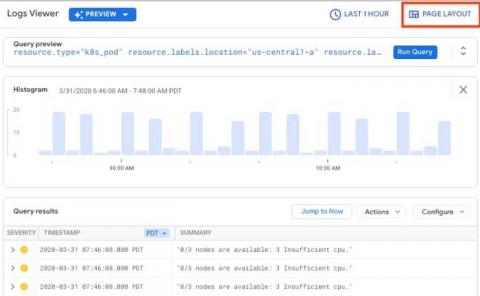
Monitoring your cloud infrastructure is an essential part of making sure your operations are running smoothly. Since announcing the new Cloud Logging interface in February, we’ve heard from users that the new interface is making it faster and easier to meet logging needs, including troubleshooting issues, verifying deployments, and ensuring compliance. One of those users, Arne Claus, is a site reliability engineer at trivago, and has taken advantage of the new interface already.
There are two ways to test software. The first and most obvious is to simply allow users to test functionality by using the software as it was intended. This is the method likeliest to produce the most useful and practical results. The other method is by automating testing. This requires a second piece of software designed to provide input and analyze output from the original application.
With 200+ plugins, Telegraf has a wide variety of methods for scraping, writing, and querying data to and from InfluxDB. However, sometimes users need to perform data collection outside of the capabilities of Telegraf. Perhaps they need to collect custom data and monitor application performance. Maybe they want to take advantage of external tools and libraries to create beautiful web-based visualizations for their users.
In the past few weeks, financial firms and governments have had to build and launch websites in a hurry — for a multitude of reasons including the emergency loan programmes that have been backed by various governments around the world including the USA and Europe.