After installing the Coralogix Security Traffic Analyzer (STA) and choosing a mirroring strategy suitable for your organization needs (if not, you can start by reading this) the next step would be to set the mirroring configuration in AWS.
AWS Elasticsearch is a common provider of managed ELK clusters., but does the AWS Elasticsearch pricing really scale? It offers a halfway solution for building it yourself and SaaS. For this, you would expect to see lower costs than a full-blown SaaS solution, however, the story is more complex than that.
Whenever you build a service and expose a set of endpoints to provide API access to that service, you’ll likely need to track their availability and response times, aside from ensuring their functionality. But to actually know that “something is down” or just “not performing” you need to consistently monitor your services day in day out and that’s how Heartbeat from the Elastic Beat family helps you with Uptime Monitoring.
Millions of people already use Kibana for a wide range of purposes, but it was still a challenge for the average business user to quickly learn. Visualizations often require quite a bit of experimentation and several iterations to get the results “just right” and this Kibana Lens tutorial will get you started quickly.
Running an ELK stack provides unrivaled benefits for your organization, however, ELK issues will inevitably crop up. ELK is scalable, and largely agnostic of internal infrastructure, making it a great asset for SMEs and enterprises. However, successfully deploying and running an ELK stack is not without its difficulties. In order to keep your ELK stack running at optimum performance, you need to familiarize yourself with some of the most common ELK issues.
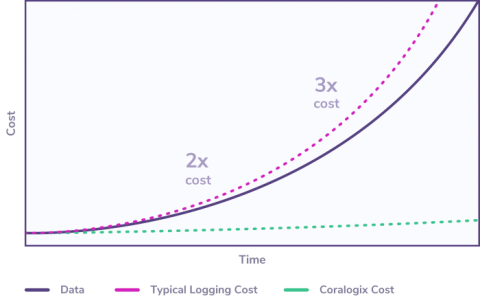
With the new Streama capability announced today, you no longer have to choose what to monitor and what to drop to manage your logging costs. For years, our customers have enjoyed the benefits of a log analytics platform that enables them to autonomously manage and analyze data in their cloud applications. Our machine learning engine empowers users to improve their system stability and accelerate their release cycles.
Ingesting various events and documents into Elasticsearch is great for detailed analysis but when it comes to the common need to analyze data from a higher level, we need to aggregate the individual event data for more interesting insights. This is where Elasticsearch Data Frames come in. Aggregation queries do a lot of this heavy lifting, but sometimes we need to prebake the aggregations for better performance and more options for analysis and machine learning.
Log maintenance has a hidden cost. Engineers optimize their instance types, storage, networking, dependencies, and much more. However, we rarely consider the engineers themselves. A DevOps culture encourages engineers to own the solutions they build. While this increases team autonomy, it risks splitting the precious bandwidth that the team has. Automation is what makes the DevOps cycle work, and it has to cover log analysis to do a thorough job of catching issues.
Fundamentally, there are logs that will be of intrinsic value to you, and others that are less business-critical. Are you aware of the logging cost to handle, analyze and store these different types of logs? Should you really have the same approach for mission-critical logs as you do for info or telemetry logs? Differentiating your approach for different logs is challenging. If no two logs are truly the same then why should you treat them the same?