Application Monitoring 101: How to surface data that matters using Custom Dashboards
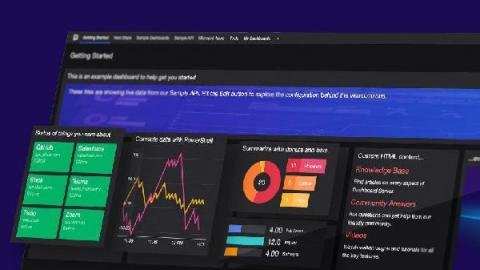
Richard Propst (Solutions Engineer @Sentry) shows how to use Custom Dashboards to set up and monitor application data that matters most to your organization.


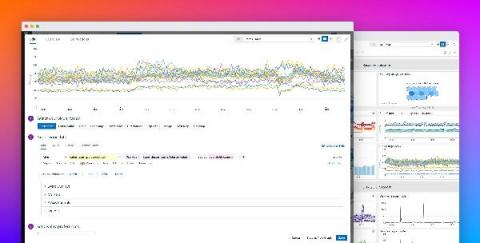
Template variables enable you to use tags to filter your Datadog dashboards to the hosts, containers, or services you need for faster troubleshooting. However, there are some cases where it may be difficult to use a standard set of template variables to aggregate all of the data you need without creating a complicated, difficult to manage set of variables. For example, you may use tag values that are a subset of another tag.
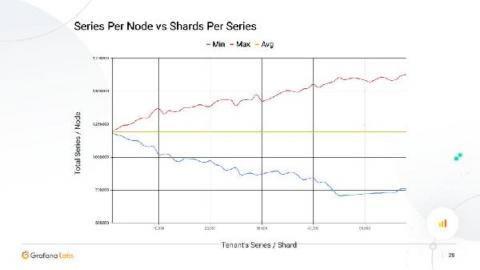
For many years, it has been possible to scale Cortex clusters to hundreds of replicas. The relatively simple Dynamo-style replication relies on quorum consistency for reads and writes. But as such, more than a single replica failure can lead to an outage for all tenants. Shuffle sharding solves that issue by automatically picking a random “replica set” for each tenant, allowing you to isolate tenants and reduce the chance of an outage.
I’ll come clean and admit it – this part of the series will be a bit interesting given the fact that I know very little about Elasticsearch. So really, this is an honest test of the question – “can I still build something good with Dashboard Server even if I only have nominal knowledge of the tool where the data is sourced from?”
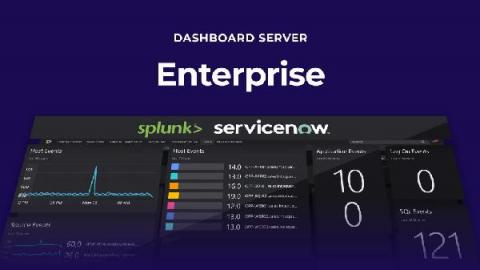
In April, we brought you the ability to dashboard any data with the new SquaredUp Dashboard Server product – for free. Then at SquaredUp Live, we announced the launch of Dashboard Server Enterprise for enterprise organizations who have got to grips with their dashboarding and now want to scale up. You can purchase unlimited named users and get endless data connections plus new, enterprise integrations that let you dashboard just about anything.
We have been collecting Logplex data for our Heroku customers for a while now. With that data we create Magic Dashboards for Postgres and Redis integrations, and track Heroku Host Metrics. Starting today, we also extract error incidents from Heroku Logplex data and provide you with a magic dashboard for Heroku status codes.
One of the greatest challenges you may face when creating Kubernetes dashboards is getting the full picture of your cluster. Kubernetes is the de-facto standard for container orchestration, but it also has a very steep learning curve. We, at Sysdig, use Kubernetes ourselves, and also help hundreds of customers dealing with their clusters every day. We are happy to share all that expertise with you in the Kubernetes Dashboards.
Whether it’s during an incident to find the root cause of the problem or during development to troubleshoot what your code is doing, at some point you’ll have an issue that requires you to search for the proverbial needle in your haystack of logs. Loki’s main use case is to search logs within your system. The best way to do this is to use LogQL’s line filters. However, most operators are case sensitive.
In this blogpost I will introduce, how to create a business process from monitored hosts and services and how to add them to dashboards. Business Process module is an interesting module in Icinga Web 2. It allows you to visualise and monitor hierarchical business processes based on any or all objects monitored by Icinga. We can create custom business process and trigger notifications at process or sub-process level.