Operations | Monitoring | ITSM | DevOps | Cloud

How to connect and monitor your Raspberry Pi with Grafana Cloud

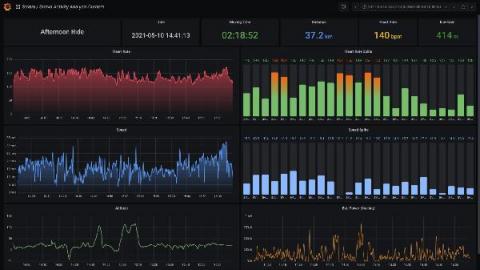
The Raspberry Pi is a popular and inexpensive device that comes in many shapes and forms. It’s a popular hobbyist tool that is generally purchased to run all kinds of software experiments on. But make no mistake, even though a Raspberry Pi comes in a tiny form factor, it’s a fully functional computer!

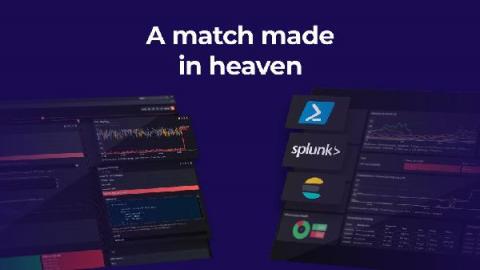
Unify your data with Grafana, wherever it lives: The ElastiSpLoki dashboard

At Grafana Labs, we believe you should unify your data, not your database. We want to help you with your observability, not own it But what if you have multiple teams using multiple open source and commercial solutions? Not a problem. To give an example, here is a quick demo of Splunk, Elastic, and Loki logs combined into one UI in #Grafana This is more than a dashboard; it's a composite panel with transformations of all three sources Your teams should be able to use best-of-breed technologies rather than being locked into one

Building powerful tailored dashboards: end users, management, infrastructure

In my position, I get to work with a wide variety of organizations that each have a different level of monitoring maturity. But I’ve noticed an emerging pattern that I’ll call the ‘Critical Service Offering’ or ‘Executive Level Status’ dashboard. At their most basic level, these dashboards should communicate the current health of the application, provide some historical context and, most importantly, not be tied to infrastructure monitoring.

Building powerful tailored SCOM dashboards with Enterprise Applications (Part 1)

In my position, I get to work with a wide variety of organizations that each have a different level of monitoring maturity. But I’ve noticed an emerging pattern that I’ll call the ‘Critical Service Offering’ or ‘Executive Level Status’ dashboard. At their most basic level, these dashboards should communicate the current health of the application, provide some historical context and, most importantly, not be tied to infrastructure monitoring.

6 tips for improving your Grafana plugin before you publish

Are you putting the final touches on your plugin before you submit it to the Grafana plugin page? In this article, I’ll share a few tips for how to add that extra polish to your plugins. This article assumes that you already have some knowledge of building plugins for Grafana. If you’re looking to build your first plugin, start by following one of our plugin tutorials.

How to map custom boundaries in Kibana with reverse geocoding

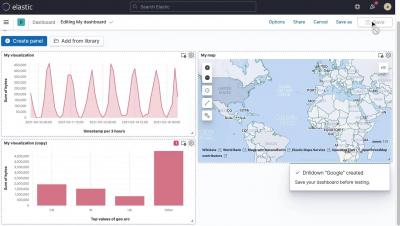
Want to create a map of where your users are? With the GeoIP processor, you can easily attach the location of your users to your user metrics. Right out of the box, Kibana can map this traffic immediately by country or country subdivision: Plus, the new User Experience app for Elastic APM automatically creates maps based on monitoring data: But what if you want to take this one step further and create maps with different regions?

Dark Theme is here

You asked, and we listened! We're excited to announce a dark theme mode for Dashboards (New)! Dashboard (New) offers a host of new visualization types, like honeycombs, time series, combination graphs, maps and more. With customizable templated dashboards, observing your system is easier than ever before. Dark theme is designed to help you do all of these actions comfortably by reducing strain to your eyes in low light environments.

Best Data Visualization Tools for a Winning Business Presentation

Data visualization is a simple presentation of data or information in a graphical format. Humans are naturally drawn to colors and patterns and these tools make it easier for people to interpret and understand data. Numbers are complex and they can be difficult to understand conceptually. Whereas, data visualization or pictorial representation can spark an interest in your audience to listen and learn more from your presentation.