Operations | Monitoring | ITSM | DevOps | Cloud

Grafana 7.4 released: Next-generation graph panel with 30 fps live streaming, Prometheus exemplar support, trace to logs, and more

Grafana v7.4 has been released! The big news for Grafana 7.4 is the next-generation graph panel called time series, which is in beta. A high-performance visualization based on the uPlot library, it uses the new panel architecture introduced in Grafana 7.0 and integrates with field options, overrides, and transformations.

A Dashboard Guide for IT Operations Metrics

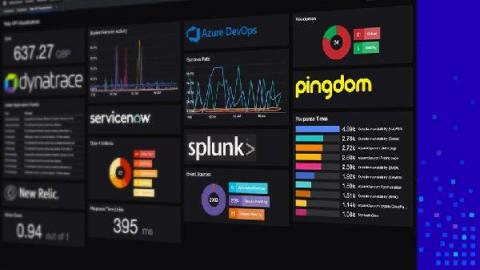
As one of the three pillars of observability, along with logs and traces, digesting metrics is a crucial part of any ITOps admins’ job. Metrics are a numeric representation of data measured over intervals of time and thus can derive knowledge of system behavior historically, which can help predict future patterns of behavior and inform investigations of issues and incidents.

SquaredUp helps customers save 20% of Azure costs

Are you suffering from overspending in Azure, lack of cost visibility and lack of context? You’re not alone; Azure cost management is a problem we hear about time and time again. That is why we created top-notch cost tiles that would allow users to build the perfect Azure cost dashboard, and help them quickly identify overspends and expensive resources in their Azure tenant.

Streamlining developer access to Prometheus and Grafana

Our Makefile entry point for developing against the Mattermost Server already tries to simplify things for developers as much as possible. For example, when invoking make run-server, this build tooling takes care of all of the following (among other things!).

Building powerful tailored SCOM dashboards with Enterprise Applications (Part 2)

In my last blog post, we focused on creating 29 Enterprise Applications (EA). We also spent some time talking about our Critical Service Offerings (CSO) and Supporting Service Offerings (SSO). And finally, we looked at three out-of-box dashboards. If all you needed was to create a dashboard to control the boxes’ color quickly, you already have what you need.

How we live-migrated massive Cortex clusters to blocks storage with zero impact to Grafana Cloud customers

January 20, 15:01 UTC. I was sitting in my home office, watching the screen and feeling a mix of emotion and nostalgia as a pod was getting terminated. We have thousands of pods, continuously starting and terminating, and I’m definitely not spending my days watching them, so why was this one special? The terminating ingester-0 pod was the very last Cortex ingester running on chunks storage in Grafana Labs’ infrastructure.

Creating dashboards based on custom filters

In this blogpost, I explain how to create dashlets using custom filters. This way you can create dashlets of your own which you find is necessary. Having dashboards in fact improves monitoring. Dashlets are the different sections under the given dashboard, which are the snapshots of some monitoring views and are defined by a name. Requirements: Icinga 2 and Icinga Web 2 installed.

Better Dashboarding - Grafana or SquaredUp?

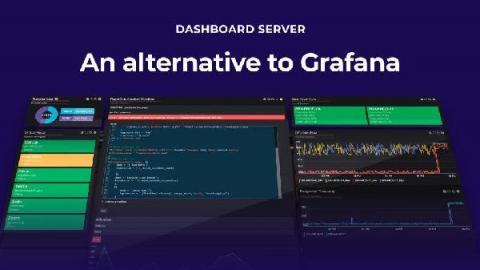
As part of my job as a tech evangelist and a pre-sales engineer here at SquaredUp, I often find myself talking to a lot of people. And understandably, when you as a consumer are trying to evaluate a product that you may potentially invest in, it’s only natural that you want to compare different products and decide which one’s better and/or offers more value for money and why.