Operations | Monitoring | ITSM | DevOps | Cloud

The latest News and Information on Monitoring for Websites, Applications, APIs, Infrastructure, and other technologies.

What's New in InfluxDB and Telegraf: Q2 2026 Product Updates

Summary: Q2 was about giving teams more leverage with less overhead. Between April and June 2026, releases across Telegraf, InfluxDB 3, and InfluxDB 3 Explorer focused on reducing manual work and putting more control directly in their hands as they scale. Telegraf Enterprise reached general availability, giving teams a centralized way to manage, monitor, and support tens of thousands of Telegraf agents.
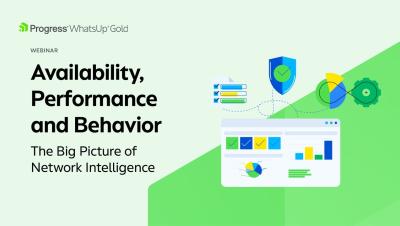
Availability, Performance and Behavior : The Big Picture of Network Intelligence

In this session, we will introduce the third dimension of network monitoring: behavioral intelligence built into the Progress WhatsUp Gold network monitoring solution. Where other tools, like SolarWinds and PRTG, require multiple modules, complex rule-writing, integrations or additional overhead, the WhatsUp Gold solution uses AI-driven behavioral analysis to automatically baseline what’s normal in your network and unveils deviations early.

How AI Agents Are Changing Each Agile SDLC Phase

The Agile software development lifecycle was designed to surface problems early, with short sprints, iterative testing, and continuous integration built on the premise that faster feedback loops produce better software. AI coding tools have changed the velocity equation across every phase of that loop, but the phases designed to catch failures are struggling to keep up because build speed and validation capacity have not accelerated at the same rate, and the gap between them is widening with every sprint.

Monitor DigitalOcean in Grafana with MetricFire

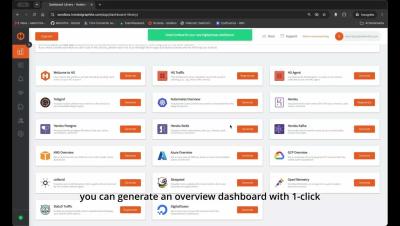
Monitoring your DigitalOcean infrastructure just got easier. MetricFire now integrates natively with DigitalOcean, so you can connect your account and start streaming metrics from Droplets, Load Balancers, Managed Databases, and more directly into Grafana. No agents. No setup overhead. No dashboard stitching. Get full visibility into your DigitalOcean infrastructure from one dashboard, live in minutes.

LogicMonitor and Edwin AI: Autonomous IT for Hybrid IT Environments

Autonomous IT starts now with LogicMonitor and Edwin AI, built to help IT teams monitor complex hybrid IT environments, discover root cause faster, reduce downtime, and prevent incidents before they impact revenue or brand reputation. See how LogicMonitor brings AI-powered IT operations, observability, and incident prevention together for modern infrastructure teams.

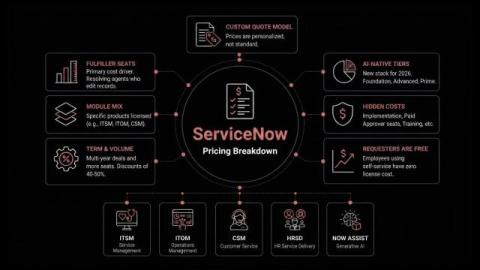
ServiceNow Pricing Explained for 2026: Plans, Tiers, and Hidden Costs

ServiceNow is a powerful, highly customizable platform built for the complex operations of mid-sized and large enterprises. Its strength is flexibility, with modules spanning IT service management (ITSM), IT operations management (ITOM), HR service delivery, customer service management, and security operations. That modular structure is also why ServiceNow pricing is not sold as a standard price list.

Best Network Monitoring Tools in 2026: Compare Top Platforms

Most network monitoring tools alert you that a device is down. The best ones help you determine whether the problem is your WAN circuit, your ISP, or your SaaS provider before your users file a ticket. Traditional network monitoring tools were built for static networks. You poll devices, check interface counters, and still can’t explain why users are complaining about latency.
Sponsored Post

CloudWatch Logs to S3: The Easy Way

Many organizations use Amazon CloudWatch to analyze log data, but find that restrictive CloudWatch log retention issues hold them back from effective troubleshooting and root-cause analysis. As a result, many companies may be looking for effective ways to export CloudWatch logs to S3 automatically. Let's look at some of the reasons why you might want to export CloudWatch logs to S3 in the first place, along with some Amazon-native and open-source tools to help you with the process.