Operations | Monitoring | ITSM | DevOps | Cloud

Detection Workflows in Cribl Detect

Get a deep dive walk through of detection posture management and detection engineering workflows within Cribl Detect. See how Cribl Detect helps view current coverage with MITRE ATT&CK mappings, pinpoints detection and telemetry coverage gaps, proactively fixes those gaps with new detection rules, automatically tunes new rules to suppress false positives, and quickly generates new detections for emerging CVEs to ensure you can quickly detect and contain adversaries’ exploit attempts.
The Top 12+ Open Source Monitoring Tools in 2026.

Open source website monitoring tools give organizations greater control over how they monitor websites, servers, applications, and infrastructure. They can reduce licensing costs, offer extensive customization, and integrate with existing workflows, but they also require more time to deploy, maintain, and scale than managed alternatives. We’ll compare some of the best open source website monitoring tools available today, from lightweight uptime monitors to enterprise-grade observability platforms.

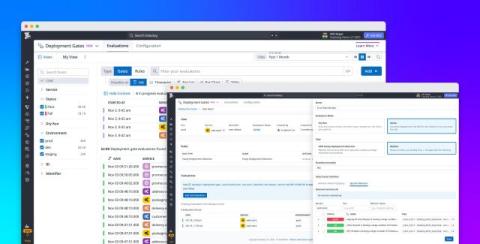
Catch incidents and pause faulty deployments automatically with Datadog Deployment Gates

As AI-assisted development helps teams create and ship more code, engineers need to check a growing volume of changes under real production conditions. Even code that passes testing can introduce errors or slowdowns in production, so early detection is essential to protecting customers. Automating those health checks helps teams keep pace by reducing the time engineers spend watching dashboards.

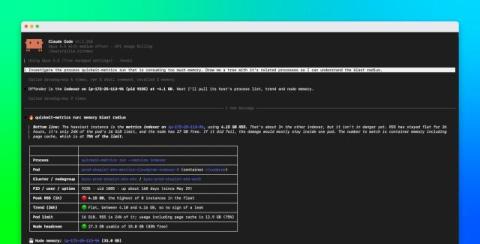
Investigate Kubernetes health and processes with the Datadog MCP Server

When investigating issues with a Kubernetes service, SREs and platform engineers need to understand what’s happening across its supporting infrastructure. For example, is a process still running? Did it restart? Is the scheduler struggling to place pods? Finding the answers to these questions often requires engineers to search process inventories, examine resource metrics, and query Kubernetes control plane telemetry.

Run cost-effective, always-on agents to monitor your environment: the engineering behind Watchers

Alert rules are great for the failures you can predict, but they fall short on the ones you can't. With the advent of modern AI, you might think the solution is to swarm your stack with agents that monitor every last detail, but that can quickly lead to astronomical bills. And those are the gaps Watchers fill: catching what alerts miss while keeping costs in control. Generally Available as of ObservabilityCON 2026, Watchers are always-on agents in Grafana Assistant.

How a broken release name overloaded our symbolication database

When a JavaScript error reaches Sentry, the stack trace points at minified code. Sentry finds the source map that was uploaded for that build to be able to show you the original file and line. Source maps are uploaded in artifact bundles. There are two ways to find the right one: Symbolicator, our open-source symbolication service, does the lookup when it processes an event.

Third party service monitoring is now in the API, MCP and CLI.

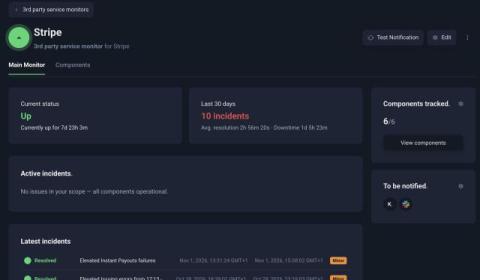
We’re happy to announce that you can set up Third party service monitoring from the UptimeRobot API, MCP server and CLI too, and get alerted when a service your product depends on has an outage. Add a provider from your deploy pipeline, ask your AI assistant whether Stripe had an incident last night, or check a provider’s status from your terminal.

Rails 8.1.4.1 Is a Big Security Release. Upgrade This Week.

Rails 8.1.4.1 is a security point release, and it’s a substantial one. It carries around a dozen CVE-level advisories spread across Action View, Action Pack, and Active Support. There are no feature changes to weigh and no behavior most apps need to plan around, which makes this the easy kind of upgrade to justify: bump it this week. (The fixes were also backported to the 8.0 and 7.x series, so you don’t have to be on 8.1 to get them.)

Bindplane's AI Agent is now generally available, plus what else we're bringing to KubeCon NA 2026

KubeCon + CloudNativeCon North America is in Salt Lake City this week, and Bindplane will be at booth 253. Come say hi! We have four talks and we're bringing a ton of cool updates with us. So many of you were eager to try Bindplane Agent while it was in early access. That changes today. Bindplane Agent is generally available. If you've built pipelines in Bindplane before, you know the drill. Pick a source, pick a destination, add processors in the right order, fill in the settings, roll it out.

Time to Rethink VMware Monitoring?

Recent security disclosures have put the Veeam Management Pack for Microsoft System Center under scrutiny. Security researchers have identified three remote code execution vulnerabilities, including one rated Critical (CVSS 9.3). According to Veeam’s security advisory, versions 9.1 and earlier in the 9.x product line are affected. Veeam will not provide a separate security fix for these versions.

How we investigated prompt cache misses with Datadog

Our internal AI applications repeatedly send the same system instructions, tool definitions, and conversation history to large language models (LLMs). Prompt caching lets models reuse this data from previously processed input, reducing the cost of handling repeated content. But while investigating our LLM costs, we found applications that weren’t benefiting from caching, even when it appeared to be enabled.

WhatsUp Gold NPM 13.1 and WhatsUp Gold NDR 13.1 Release Update

Most IT teams do not have the luxury of separating network operations and security professionals into different groups. The same teams need to investigate a slow application and examine unusual traffic patterns or security issues. The latest Progress WhatsUp Gold NPM and Progress WhatsUp Gold NDR releases include new functionality that directly addresses this reality. Both WhatsUp Gold NPM and WhatsUp Gold NDR have been updated to shorten the time between discovering an issue and understanding it.

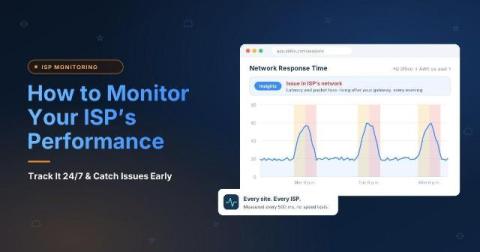
How to Monitor Your ISP's Performance: A Step-by-Step Guide for IT Teams

Most ISP problems don't show up as low speed. They show up as calls that break up every afternoon, a cloud app that times out at one branch, or a connection that drops for 30 seconds and recovers before anyone can test it. By the time someone runs a speed test, the results look fine, and ISP support asks for evidence you don't have. Continuous monitoring solves this by measuring all the time, so the data is already there when something goes wrong.

Any agent anywhere: How to use Grafana Cloud with Claude, Cursor, and any other AI agent

AI agents are becoming part of everyday engineering workflows, helping teams write code, troubleshoot issues, and automate tasks. But to be truly useful in production, these agents need access to more than code. They also need observability data and context to understand what's happening across your systems, investigate problems, and help you take action.

Occupational Safety Tech: How Modern IoT and Sensors Are Preventing Future Worksite Toxins

Chemicals lurk in industrial air unnoticed until someone gets sick. According to estimates from the International Labour Organization, over one billion workers face hazardous substance exposure globally every year.

Top tips: 4 tips to fix your phone's storage problem

Top tips is a weekly column where we highlight what's trending in the tech world and list practical ways to explore these trends. This week, we're clearing out the one notification nobody wants to see: storage full. You’re about to capture the perfect moment and a message pops up: Storage full. The same sentiment applies to a fridge:Nobody means to overstuff it, but a little goes in every day at a faster rate than items come out, until a lemon ends up balanced on the edge of a shelf.

Monitoring WooCommerce Background Jobs with AppSignal

WooCommerce relies on a lot of work happening in the background. Some of that is handled by WordPress cron, while other tasks are queued through Action Scheduler. This can include things like sending scheduled emails, processing subscription renewals, delivering webhooks, running scheduled WooCommerce actions, and other maintenance tasks that do not happen during a normal page request. The problem is that when one of these background jobs stops running, it is not always obvious straight away.

What's new with Grafana variables: less clutter, easier reuse across dashboards, and more

Template variables are one of the most used features in Grafana, providing users with a dropdown to turn one dashboard into hundreds: pick a different cluster, region, or service, and every panel updates. For most of Grafana's history, variables had a single home at the top of the dashboard. Each dashboard had one flat list of variables, and that list was shared by every panel on it. But as dashboards grew in size and number, those controls became harder to organize and maintain.

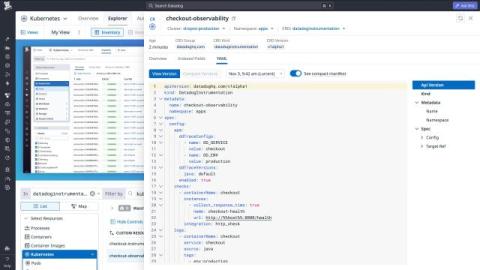
Manage Kubernetes observability with DatadogInstrumentation

For teams that own an application running on Kubernetes, updating its observability configuration should be as straightforward as updating any other Kubernetes resource. But configuring integration checks, log collection, and tracing often means working across multiple configuration paths. If those settings live in pod annotations, adding a metric check or changing log processing rules requires a Deployment rollout.

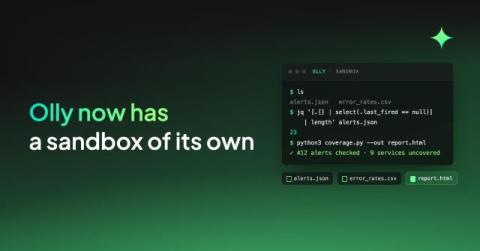
With a sandbox workspace of its own, Olly answers bigger questions

Ask Olly to audit your alert coverage and it pulls the whole set through the API, works through it with a script, and hands back the gaps as a report you can send to the team. DataPrime and PromQL already answer the questions that fit a query language, and Olly has been answering those for a long time. The sandbox is for everything else: the sources that have no query language of their own, the correlations that span two languages at once, and the analysis that needs a script rather than a filter.

What Is OpenTelemetry? A Guide to the OTel Framework

OpenTelemetry (OTel) is an open-source observability framework, hosted by the Cloud Native Computing Foundation (CNCF), that standardizes how your applications generate, collect, and export telemetry data such as traces, metrics, and logs. The instrumentation stays vendor-neutral, so you can instrument a service once, send its telemetry to the observability tool your team uses today, and point it at a different tool next year without touching application code.

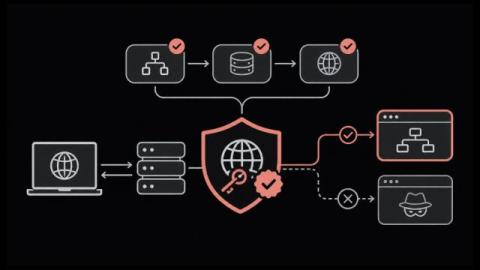
What Is DNSSEC? How DNS Security Extensions Stop Spoofing

Why would a domain with correct records, healthy name servers and a valid certificate stop resolving for part of the internet? Often it's DNSSEC. Your records are fine; the signatures behind them are not, and any resolver that checks signatures now refuses to answer. DNSSEC was designed to stop spoofing and cache poisoning, and it works. The catch is operational.

9 Best Cisco Network Monitoring Tools in 2026

Does your IT team have a clear view of your Cisco network's health and performance? Cisco routers, switches, firewalls, and wireless devices need regular monitoring to catch network issues before they affect users. Cisco network monitoring tools help you: However, not every tool supports Cisco technologies such as Meraki, IP SLA, ACI, and SD-WAN. In this guide, we compare 9 Cisco network monitoring tools based on their features, limitations, deployment options, and pricing.

Highlights from Oracle AI World 2026

Oracle AI World 2026 brought customers and partners to Las Vegas to explore how AI can support their existing business systems. At the event, Datadog participated in a session with Peloton Consulting Group and hosted a booth covering observability across Oracle Fusion Cloud Applications, Oracle Database, and Oracle Cloud Infrastructure (OCI).

Accelerate troubleshooting with Monitor AI Insight

Monitoring used to mean checking that your dashboards looked fine and starting to troubleshoot when something broke. That approach is outdated. Today, the health of your applications directly affects your business. A slow checkout page, a lagging database, or an unresponsive server costs you customers, revenue, and trust. A problem that once took hours to identify and fix is no longer acceptable. This is where AIOps comes in.

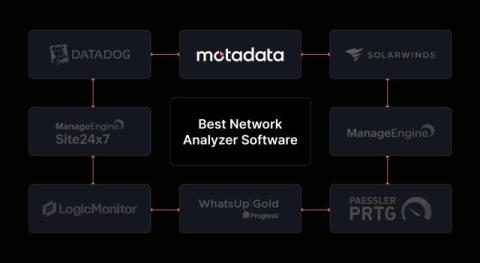
8 Best Network Analyzer Software in 2026

Does your IT team know which applications, users, or devices are consuming the most network bandwidth? A video call freezes, file transfers slow down, or a network link becomes congested. Without traffic analysis, finding the source of the problem can take hours. Network analyzer software helps your IT team: However, tools differ in how they collect traffic data. Some analyze flow records, while others also inspect packets to provide more detail.

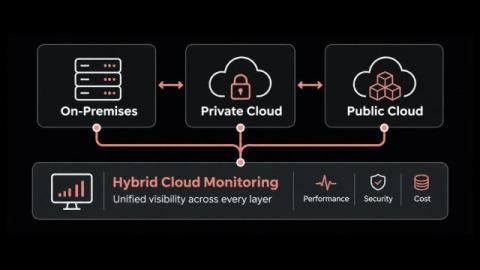
Hybrid Cloud Architecture: Components, Models and How to Monitor It

Why does an application that runs well in the data center slow down once one of its tiers moves to AWS or Azure? Often the servers are healthy and the cloud console shows no faults; the delay lives in the connection between them, where neither view reaches. That blind spot shows up in familiar ways: So these are design problems before they are operational ones.

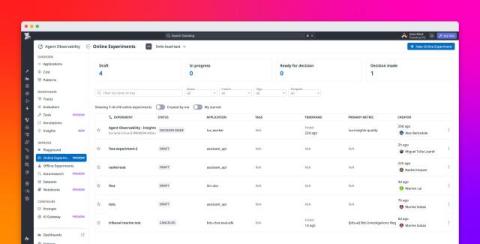
Compare AI agent changes with Online Experiments in Agent Observability

Improving an AI agent often involves changing its prompts, models, retrieval methods, or tools. But determining whether those changes actually improve performance can be difficult. A revised prompt might produce better answers for a handful of test cases but perform poorly on unexpected user requests. A cheaper model might reduce token costs while introducing tool-calling errors or longer execution times.
Nokogiri 1.19.5 Closes Three Security Advisories and a Wave of Compaction Crashes

Nokogiri sits under so much Ruby code that its patch releases are worth reading even when the version number looks routine. 1.19.5 is a patch release carrying three security advisories and a long list of crash and memory fixes, so it’s worth pulling in on your next dependency pass.
Good Agents Need Good Managers: What We Heard at Innovation Week

I used to joke that I got my best parenting ideas from management books, and my best management ideas from parenting books. Now, I'm extending it to agents. Hear me out. When you're teaching a teen how to drive, you don't hand them the car keys on day one. You start in an empty parking lot. You ride along and ask them to talk through what they're doing.

LogicMonitor Elevate 2026 Keynote: Trusting AI to Act

LogicMonitor Elevate 2026 keynote: what it takes to trust AI to act in IT operations. Built for IT ops leaders, SREs, and MSPs. The Chicago opening keynote covers moving beyond the alert loop, where people have acted as the integration layer between tools. IT teams are automating incident response by giving AI context, clear guardrails, and governance, with people accountable and in control. @globalfoundries CIO Vishal Mehra shares how his team's doing it.

Data Residency in Observability: A Security Review for Your Own Cloud

A data residency security review for observability in your own cloud account: vendor access, connection direction, PII redaction and egress, with what Last9 documents. Last9 is an observability platform built for high-cardinality telemetry. It unifies logs, metrics, and traces with native OpenTelemetry and Prometheus support, real-time alerting, and long-term retention.

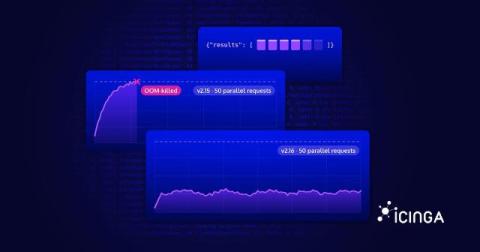
The Icinga 2 Memory Leak That Wasn't

Sometimes you just want to fetch all Icinga 2 objects of a given type from the API and do something with them. Then you notice that Icinga 2’s memory usage jumps up with every large request and never comes back down, as if each HTTP request leaked a huge chunk of memory. And once enough of these requests run in parallel, no matter how much RAM the machine has, Icinga 2 runs out of memory and crashes. Here’s what was really going on, and how we fixed it in Icinga 2 v2.16.

Wide Events vs Metrics, Logs and Traces: What Observability 2.0 Costs

Wide events move observability cost instead of removing it. See what each signal is billed in, which question each answers cheapest, and how to size spend against cloud spend. Sejal Pandey works on content and growth at Last9, writing about observability, reliability, and SRE practices.

Automated Alert Triage: Route Alerts to the Root-Cause Team

Rule-based routing pages the service that errored. Build a small triage service that reads the alert webhook, finds the origin span in your traces and pages the team that owns it. Last9 is an observability platform built for high-cardinality telemetry. It unifies logs, metrics, and traces with native OpenTelemetry and Prometheus support, real-time alerting, and long-term retention.

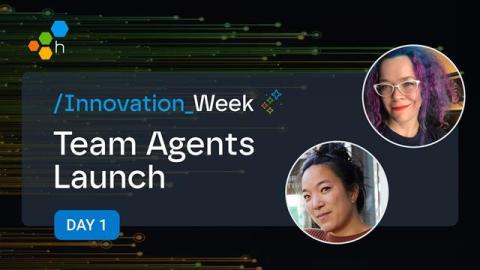
Honeycomb Team Agents: AI SRE Done Right

The best alert is the one that never fires. Picture an idyllic Tuesday afternoon: last night's release nudged checkout p99 up 41%, but an agent noticed. Nobody got paged, and your SLOs didn't start burning. Instead, the agent acted and already narrowed it down to one retry change. It filed a ticket for the Payments team and flagged the PR. By the time anyone would have noticed, the fix is in review. That's what SRE was always supposed to feel like.

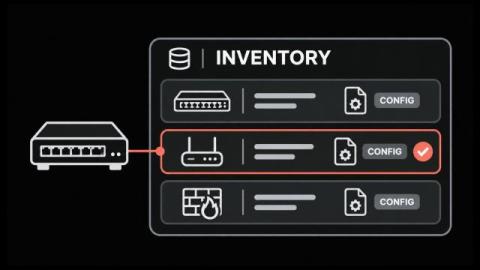
Network Inventory Management: How to Track Every Device and Config

How many devices are on your network right now? The usual answer is “check the spreadsheet”, and nobody is quite sure which copy is current. That's awkward during an outage and worse during an audit, or on the day a vendor advisory asks which switches run a vulnerable firmware build. Network inventory management retires that spreadsheet. In its place, you get a record that changes when the devices do, with hardware, addresses, VLANs and every router and switch config in one place.

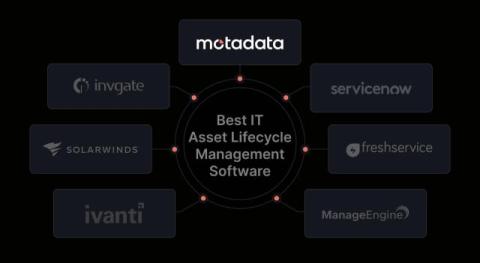
7 Best IT Asset Lifecycle Management Software in 2026

If your IT team struggles to track devices, software licenses, warranties, and contracts, managing assets can become difficult. IT asset lifecycle management software helps you track every asset from purchase to retirement. It gives your team a clear record of: However, tools differ in their discovery methods, lifecycle workflows, license tracking, deployment options, and pricing. In this guide, we compare 7 IT asset lifecycle management software tools based on their features, limitations, and pricing.

Trace linkage: connect the dots between your app traces and database queries

When an application request slows down, a trace can show a database call. Finding the database query behind it can be tedious, requiring you to switch between traces and database telemetry, as well as match timestamps or query text by hand. In Grafana Cloud, the Database Observability app already provides a window into all of your database telemetry, including query samples, performance history, and explain plan.

Search Sentry in Plain English

Did you know you can search your Sentry data the way you'd ask a teammate? In this video, I use plain English to query traces, metrics and logs in Sentry's Explore pages, and Sentry turns each question into a real query for me. Using my skateboard parts store as the example, I ask three questions: For each one, Sentry picks the filter, the visualization, the group-by and the sort order. I didn't need to know the span operation, the metric name or the exact log message. Once you have the result, you can add it to a dashboard or turn it into a monitor so you keep an eye on it.

MongoDB's Node Driver 7.8.0 Patches Two Real Security Issues

If your Node app talks to MongoDB through the official mongodb driver, 7.8.0 is worth upgrading to before your next routine dependency pass. It’s a minor version by the number, but it carries two security fixes, and one of them changes how a feature you may already be using behaves.

Bridging Alloy and OpenTelemetry: the OTel engine is now in Public Preview

Many Grafana Cloud customers love what Alloy offers them, but we're also seeing a growing base of users who feel the same way about the OpenTelemetry Collector. We want to make it easy for customers to make the decision that makes the most sense, regardless of their preference.

Dissecting Rails Migrations: Anatomy, Rollbacks, and Errors (Rails 8.1)

A Rails migration is a timestamped Ruby class inheriting from ActiveRecord::Migration whose change method alters the database schema. bin/rails db:migrate runs each pending migration once, records its version in the schema_migrations table, and dumps the result to db/schema.rb. Rollbacks invert change; irreversible steps need up and down. On PostgreSQL and SQLite, each migration runs inside a transaction.

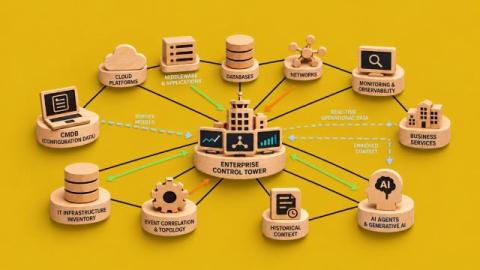
Why AI-Ready IT Operations Need More Than a Traditional CMDB Now?

Configuration Management Databases (CMDBs) have long played an important role in IT Service Management, providing a structured record of technology assets, their configurations and relationships. For enterprises managing complex IT environments, they remain a valuable foundation for understanding infrastructure and supporting operational processes.

What's New in VictoriaMetrics Cloud Q3 2026? VictoriaTraces, a Revamped Overview and Monitoring, Alerting for Logs and Traces, and a new Beta coming soon

Q3 2026 has been one of the greatest quarters for VictoriaMetrics Cloud, and that is thanks to the whole team, including open source, of course. The big milestone is that VictoriaTraces is now part of VictoriaMetrics Cloud, which means that the full VictoriaStack lives in one managed place, with a single bill and the same experience users already know.

Pushing metric concurrency, cardinality, compute and retention limits with $1000 of infrastructure

We gave five metrics backends the same budget, the same week of data and the same ten queries, then ran those queries at rising concurrency. At one query at a time, the open source engines looked strong. Under concurrency, two of them stopped answering, and the rest slowed down by an order of magnitude.

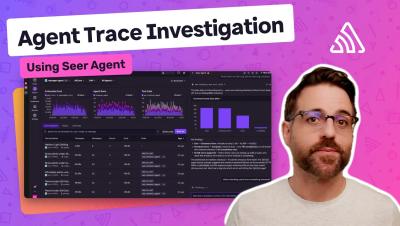
Finding performance wins in our own traces with a coding agent

For the last few weeks I’ve used a coding agent to find and fix backend performance issues in Sentry, starting from the traces Sentry sends to itself. Most of the fixes only changed a line or two. But together, they removed hundreds of millions of queries a week, and some expensive lookups became hundreds or thousands of times faster (more details on that below).

When Does Insight Become Guided Action?

AI can already tell operations teams what is wrong. The harder part is everything between knowing and doing. Skylar is closing that gap through guided action: recommendations grounded in live operational context, reviewed by the right owner, and connected to governed execution. In many post-incident reviews, the surprising moment is not when the team finally understood the problem. It is when they realize how long the organization waited after it already knew enough to act.

Evaluate your AI agents with Fireworks AI models in Datadog Agent Observability

Teams that build agents on open models hosted on Fireworks AI, such as GPT-OSS, Kimi, GLM, Qwen, and MiniMax, need a reliable way to measure whether their LLM applications and agents are giving accurate, safe, and helpful answers efficiently. Datadog Agent Observability now supports Fireworks AI as a model provider, so you can get end-to-end visibility into your agents built on Fireworks AI, from traces and token usage to quality evaluations.

IBM MQ Alternatives: When ActiveMQ and Artemis Make Sense

What IBM MQ costs an organisation is a knowable figure. It comes off a renewal statement, an entitlement count or a licensing review, and finance can put a number against it down to the core. What replacing it would save is not knowable in the same way. There is no independent case study in the public record carrying real durations, team sizes and application counts, and every migration timeline in circulation comes from an organisation selling the migration.

The Jolokia Problem: Eight CVEs, One Door in Apache ActiveMQ

The Apache ActiveMQ Jolokia endpoint has been the route to remote code execution in three separate years. In 2023, it was reflection into the JVM. In 2024, a default configuration left it without a login. In 2026, it was the broker's own management operations, patched in March, exploited in April, and reopened three more times by summer.

Episode 19- What Gen Z Actually Thinks About AI

In Part 1 of this conversation, three early-career professionals at Digitate — Ryan Bascos, Renad Morrar, and Ritu Bhalodia — join The Intelligent Enterprise to share what it actually feels like to start a career in the age of AI: the tools they rely on, the concerns they carry, and what their generation sees that others might be missing.

Instrumentation Hub in Grafana Cloud: start easier, stay in control

It's no secret that getting started with observability can be much harder than it should be. That's why, at ObservabilityCon 2025, we introduced Instrumentation Hub: a guided, scalable way to roll out observability coverage while still keeping you in control. Today, we’re excited to announce that Instrumentation Hub is now Generally Available in Grafana Cloud.

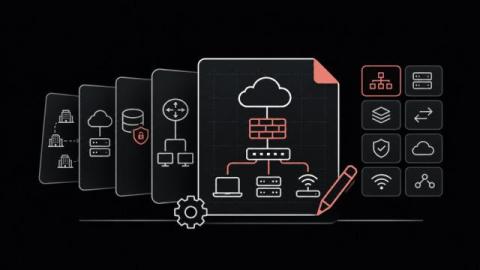
Network Diagram Examples: 8 Types and How to Draw Them

Most network diagrams we come across land in one of two piles: the one drawn for an audit years ago and never opened since, and the one so crowded that finding the firewall takes squinting. The network diagram examples below sit between those piles, 8 diagrams IT teams actually use, sorted into physical, logical, and cloud or WAN. For the full build process behind one map, see our guide to the network topology diagram.

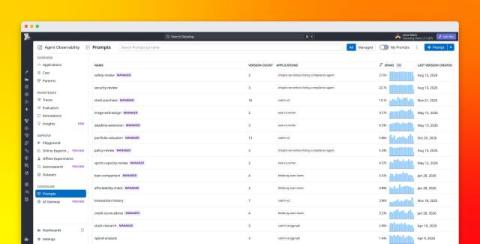
Manage and deploy LLM prompts with Datadog

Prompts are an important part of LLM application behavior, but teams often manage them alongside application code or across separate notebooks and configuration files. This can make prompt changes dependent on application releases and make it difficult to understand which version is running in each environment. When a change affects application quality, latency, or cost, teams also need a way to connect that behavior back to the prompt version that produced it.

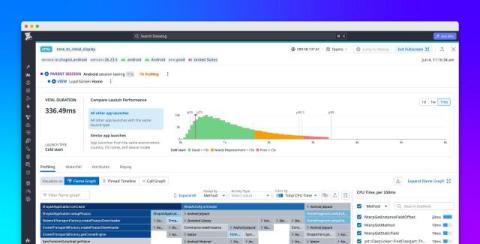
Diagnose frontend performance issues with RUM Profiling

When a mobile application takes too long to launch or becomes unresponsive, it can be difficult to find the cause. Datadog Real User Monitoring (RUM) helps developers detect these issues and understand which users are affected. But knowing that an application is slow doesn’t tell you which part of its code is responsible. Engineers often need to reproduce the problem locally, piecing together performance metrics and code execution information from separate tools.

What Is Cloud Networking? Types, Benefits and How to Monitor It

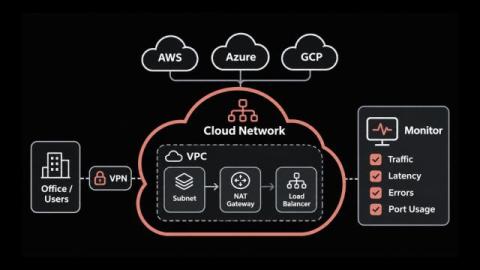
Think about Outlook, Salesforce or the shared drive your staff open each morning, and at least one of them probably runs in AWS, Azure or Google Cloud. That puts a good share of your traffic on a cloud network nobody on your team has ever seen. You still own a lot of that path (the VPN link, the route tables, the security groups), and it breaks in ways an office network doesn't.

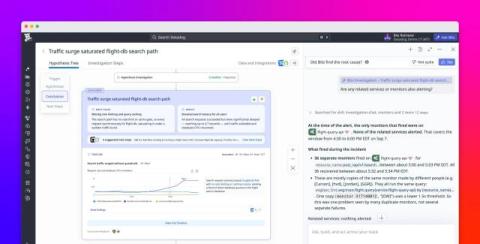
Bits investigations are faster, more accurate, and cost less

When we launched Bits Investigation in December 2025, our goal was to give teams an always-on agent that could investigate every alert and reduce mean time to resolve (MTTR). Since then, we’ve focused on making Bits faster, more cost effective, and even more accurate. At launch, the average investigation cost $25 and took 11 minutes.

Grafana Assistant Demo: AI-Powered Root Cause Analysis and Remediation

See how Grafana Assistant uses AI to investigate incidents, identify root causes, and help remediate application problems. In this demo, Engineering Manager Ksenia Yadav and Staff Product Manager Maurice Rochau show how AI-powered observability supports the move toward autonomous operations, from detecting problems to generating code fixes and validating their impact in production. Explore how Grafana Assistant uses context from your telemetry, infrastructure, incidents, business data, and code to.

What happened when we gave $10k worth of data to 5 observability platforms | Live Laugh Logs

We gave $10k worth of data to five different observability platforms. Which agent finds the true answer? In the first episode of our benchmarks series, Chris and Annie walk through how an agent performed on Coralogix, Datadog, New Relic, Dynatrace and Grafana Cloud across 10 injected incidents. They also explain why sampled data makes agents "hallucinate the gap". Subscribe to our channel for more benchmarks and insights into observability and AI.

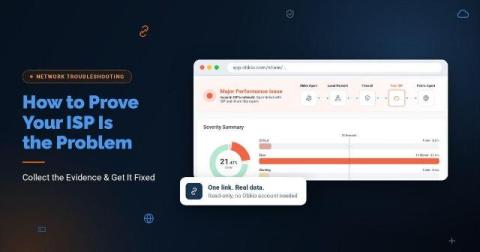
How to Prove Your ISP Is the Problem (With Data)

You call your ISP because calls keep dropping and the Internet crawls every afternoon. Support asks you to restart the modem. Then they test the line from their side, see nothing wrong, and tell you everything looks fine on their end. By the time a technician shows up, the problem is gone, and the ticket gets closed. The issue usually isn't that your ISP doesn't care. First-line support is trained to rule out the customer's network first, and most complaints arrive with nothing they can check.

Full-Stack Observability with Grafana Cloud: From Business Impact to Root Cause

How do you trace a dropped conversion or a checkout failure to its technical root cause? See how full-stack observability in Grafana Cloud connects business impact to system performance across web and mobile clients, applications, infrastructure, and databases. In this session, Principal Software Engineer Jim Gehrett and Staff Product Manager Sarah Constant demonstrate how to start with a business problem and work backward through the technology stack to investigate its cause.

How Uber Optimizes Code at Scale with Grafana Cloud Continuous Profiling & Grafana Assistant

How does Uber use continuous profiling to improve performance and resource efficiency across several million CPU cores? In this Grafana Cloud case study, Senior Researcher Chris Zhang from Uber’s Frontier Tech Labs explains how the team uses Grafana Cloud Profiles and Grafana Assistant to identify expensive code and scale code optimization across its production systems.

Android profiling now uses Perfetto via ProfilingManager

Starting with Sentry Android SDK 8.51.0, profiling on Android 15+ devices is powered by Perfetto, through Android’s system ProfilingManager API. That means fewer legacy tracer crashes, lower CPU and memory overhead, and more representative profiles. You don’t need to change any configuration: if you already use continuous profiling, devices on Android 15 and newer pick up the new profiler as soon as you upgrade.

Can driver-monitoring systems help prove fault in a rideshare crash?

Driver-monitoring systems are increasingly used by rideshare companies to capture data during every trip. These technologies gather detailed information that can become crucial evidence in resolving rideshare accidents. Understanding how this evidence is collected, preserved, and accessed is important for both passengers and legal professionals in places such as Paramus.

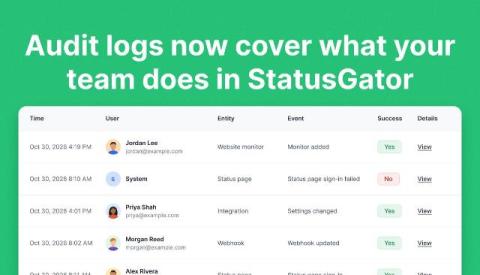
Audit logs now cover what your team does in StatusGator

StatusGator’s audit logs now track more of your team’s activity, including changes to monitors, incidents, scheduled maintenance, status pages, and integrations. Previously, audit logs focused on sign-ins and account security. With this update, organization admins can also see who changed a monitor’s component filters, rescheduled maintenance, resolved an incident, or updated a status page’s password.

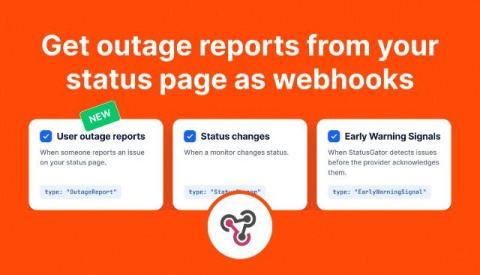
Get outage reports from your status page as webhooks

StatusGator webhooks now support user outage reports, so you can send reports from your status page to your own tools as soon as they’re confirmed. We’ve also added event settings to each webhook, letting you choose which notifications an endpoint receives. Use outage reports to create support tickets, alert your on-call team, or collect reports for analysis. Each payload includes the affected service, selected components, the reporter’s comment, and their approximate location.

The $6.3B Binance Hack: What Happened and What It Teaches Security Teams About Investigation

TL;DR On October 29, 2026, attackers drained about $6.3 billion in crypto assets from Binance’s hot wallets, the largest crypto theft on record. Binance says the incident may have started with a compromised laptop, but its investigation has since found additional points of breach, and the root cause is still being confirmed. For engineering and security teams, the lesson is about how quickly you can reconstruct what happened across many systems once something goes wrong. In this post.