PagerTree Routing Rules
PagerTree intelligent on-call alert routing gives teams flexible schedules, escalations, & reliable notifications via email, SMS, voice, chatbots, & smartphone app.


An always-on world requires a proactive and preventative approach to managing your digital operations. PagerDuty is proud to announce our latest release, which helps streamline remote remediation by providing an at-a-glance overview of your system’s health. While we’re known for on-call management and incident response, PagerDuty does much more, including providing visibility into the business impact of an incident.
Seemingly simple digital moments, like checking into a flight, trigger a complex technical flow of events under the IT covers. A simple swipe or click relies on a complex IT ecosystem made up of millions of lines of code, spanning multiple software applications, hybrid and multi-cloud technologies, state-of-the-art IT infrastructure, security apps, and more.
We no longer live in a world where a few tools determine the way organizations structure their processes. From IT Service Delivery to Incident Response, Modern IT Operation Solutions need to embody the flexibility that most Enterprises require. The dynamic ITOps ecosystem has shifted to put choice back in the hands of the user. Now, IT Solutions must follow suit. Modern Incident Response platforms, in particular, need the flexibility that enterprises need to mirror their enterprise architecture.
I’ve offered some tips up for folks who are oncall during the COVID-19 crisis, but I thought it would be helpful to get some more ideas from people with different perspectives. So I reached out to some people I trust to see what they had to say. They all have different viewpoints, but some themes emerge, like managing alerts, having empathy, and practicing self-care. The participants, in alphabetical order: Aaron Aldrich is a Developer Advocate at LaunchDarkly, with a focus on DevOps.
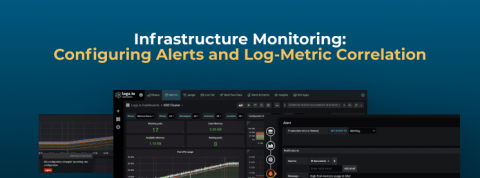
If you’ve followed our latest blog posts, you’ll have learned how to send metric data to Logz.io and visualize that data on Infrastructure Monitoring – our Grafana-based metrics monitoring solution that we made Generally Available on Monday. At this point you’ll have some nice looking Grafana dashboards in your account.