Operations | Monitoring | ITSM | DevOps | Cloud

The latest News and Information on Containers, Kubernetes, Docker and related technologies.

Building a Custom Grafana Dashboard for Kubernetes Observability

Distributed systems open us up to myriad complexities due to their microservices architecture. There are always little problems that arise in the system. Therefore, engineering teams must be able to determine how to prioritize the challenges. Viewing logs and metrics of such systems enables engineers to know the shared state of the system components, thereby informing the decision-making on what challenge needs to be solved most immediately.

Getting Started With Observability on Kubernetes | Webinar with Ricardo Santos and Andreas Prins

Monitoring has traditionally been a way for IT operations to gain insight into the availability and performance of its systems. However, today IT organizations require more than just monitoring. They need a deeper and more precise understanding of what is happening across their IT environment. This is challenging, as infrastructure and applications span multiple environments and are more dynamic, distributed and have to support more ongoing change than ever before.

How to Avoid Getting Your Pod OOMKilled

In this blog, understand why your pod has OOMKilled errors when provisioning Kubernetes resources and how Speedscale can aid with automated testing. When creating production-level applications, enterprises want to ensure the high availability of services. This often results in a lengthy development process that requires extensive testing for the applications or a new release.

Why DevOps Engineers Love and Recommend Qovery

My team and I built Qovery to empower DevOps engineers and Developers to better work together - without compromises. In 2022, DevOps engineers need to build reliable infrastructure on top of the best cloud service providers (e.g. AWS, Azure, GCP), dealing with security concerns, productivity, reliability, and many services. DevOps engineers are responsible for a lot of things in an organization. From CI/CD, to the run of the apps in production and the backup of databases.

Collect critical AWS metrics faster with Sysdig

Today, we are excited to announce support for Amazon CloudWatch Metric Streams. This support will enable our customers to ingest metrics from AWS CloudWatch in real time, increase metric and state fidelity and time to ingestion while decreasing MTTR, and support cloud metrics at scale without the need to customize or re-configure new AWS service metrics. In this blog, we dig deep into.

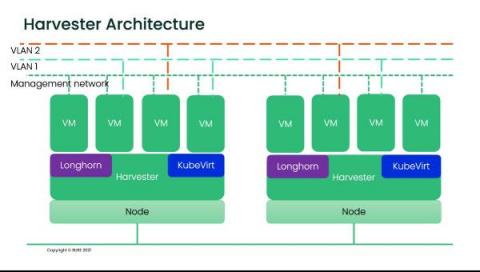
Kubernetes 101: How To Set Up "Vanilla" Kubernetes

Kubernetes is an open source platform that, through a central API server, allows controllers to watch and adjust what’s going on. The server interacts with all the nodes to do basic tasks like start containers and pass along specific configuration items such as the URI to the persistent storage that the container requires. But Kubernetes can quickly get complicated. So, let’s look at Vanilla Kubernetes — the nickname for a a K8s setup that’s as basic and elementary as it gets.

CICD Pipeline | Case Study | Razorops | 72pi

72pi is an all in one platform that enables you to compare and adjust your portfolios based on various parameters and complement your investment process and become a smarter investor at portfolio construction. With Razorops they are able to move and fix faster. Efficient feedback and a fast CI/CD pipeline allowed their team to do frequent end-to-end production deployments and get products into customers hands more quickly and efficiently.