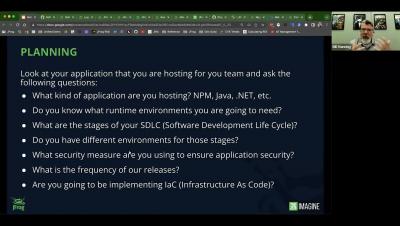
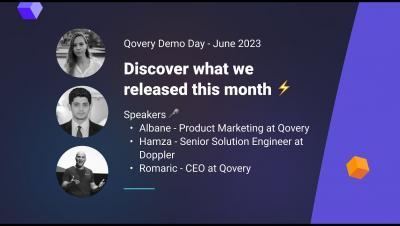
Are you thinking about switching from platform engineering to DevOps? You're not alone. In order to remain competitive, many organizations are making this crucial change as the world of software development and operations continues to change. This article will discuss the reasons behind the transition, what it implies, and most importantly, how your organization may successfully manage the change.
This month, Sysdig has released Process Tree which enriches the Events feed for workload-based events. This helps with identifying all the processes that led up to the offending process. This is in technical preview status. Sysdig has also released Sysdig Secure Live.
A containerized approach to software deployment means you can deploy at scale without having to worry about the configuration of each unit. In Kubernetes, clusters do the heavy lifting for you—they’re the pooled resources that run the pods that hold your individual containers. You can divide each cluster by namespace, which allows you to assign nodes (ie the machine resources in a cluster) to different roles or different teams. Resource quotas limit what each namespace can use.
In my previous blog post, I discussed how transitioning from legacy monolithic applications to microservices based applications running on Kubernetes brings a range of benefits, but that it also increases the application’s attack surface. I zoomed in on creating security policies to harden the distributed microservice application, but another key challenge this transition brings is observing and monitoring the workload communication and known and unknown security gaps.
Expenditure on cloud computing services reached a mammoth 225 billion dollars in 2022. Companies start their cloud-native journeys with the best intentions and consume the many benefits including: But current cloud expenditure growth levels are unsustainable for many organizations and with 82% of organizations investing in FinOps staff it shows that cloud expenditure is top of mind in the c-suite.
When Kubernetes components like nodes, pods, or containers change state—for example, if a pod transitions from pending to running—they automatically generate objects called events to document the change. Events provide key information about the health and status of your clusters—for example, they inform you if container creations are failing, or if pods are being rescheduled again and again. Monitoring these events can help you troubleshoot issues affecting your infrastructure.
Want to monitor all of your application's services? Our Standalone Agent allows you to monitor processes our standard integrations don't monitor by default, helping you effortlessly expand your monitoring capabilities. To help simplify the process of configuring our standalone agent, we're excited to announce the launch of our Standalone Agent's Docker image, available on Docker Hub under the name appsignal/agent.
Health checks for cloud infrastructure refer to the mechanisms and processes used to monitor the health and availability of the components within a cloud-based system. These checks are essential for ensuring that the infrastructure is functioning correctly and that any issues or failures are detected and addressed promptly. Health checks typically involve monitoring various parameters such as system resources, network connectivity, and application-specific metrics.
June 27, 2023 We were excited to learn last week that GigaOm named Densify as both a Leader and an “Outperformer” in its new report “Radar for Cloud Resource Optimization”. This was particularly meaningful to us for a few reasons.
In this post we will examine using NeuVector Network rules to enable multi-tenancy isolation in openshift. Also how we can isolate external traffic from specific workload.
In this post we will explain how to use OpenShift monitoring (alert manager) to monitor NeuVector using NeuVector prometheus-exporter NeuVector has published a Prometheus exporter which we will use in the post.
As your Kubernetes infrastructure — and your business — grows, so too does the headache of managing your stack. And since controlling costs is crucial for your organization’s well-being, you need visibility into your complex system to ensure you’re spending your money wisely. That’s why we’re excited to introduce Kubernetes cost monitoring as a new feature in Grafana Cloud.
As we are now 6 months into the year, I thought this would be a great time to sit and reflect on everything that has happened at Civo so far (and some of the plans we have in the pipeline). If you’re interested in taking a look at our previous roadmaps.
Reviewing the Current State of Infrastructure as Code (IaC), its Challenges, the Emergence of Crossplane, Adoption Difficulties, and the Road Ahead! Infrastructure as code (IaC) has become an indispensable practice for managing and deploying cloud-native applications. By defining infrastructure through code, developers can efficiently and consistently manage their infrastructure. In this post, we’ll delve into the state of IaC, the problems it poses, and the new approach offered by Crossplane.
As Kubernetes continues to gain popularity as a container orchestration system, mastering its command-line interface becomes increasingly vital for DevOps engineers and developers alike. Kubectl, the Kubernetes command-line tool, is an essential component in managing and deploying applications in a Kubernetes cluster. This tool allows you to interact directly with the Kubernetes API server and control the state of your cluster.
AWS Fargate is a serverless pay-as-you-go engine used for Amazon Elastic Container Service (ECS) to run Docker containers without having to manage servers or clusters. The goal of Fargate is to containerize your application and specify the OS, CPU and memory, networking, and IAM policies needed for launch. Additionally, AWS Fargate can be used with Elastic Kubernetes Service (EKS) in a similar manner.
Before attending Icinga Berlin in May this year, Daniel Bodky and Markus Opolka from our partner NETWAYS developed the very first Icinga Kubernetes Helm Charts and released it in an alpha version. If you have ever wanted to deploy an entire Icinga stack in your Kubernetes cluster, now is your chance. I also want to highlight Daniel’s talk again on how Icinga can run on Kubernetes and the challenges involved.
Fleet, also known as “Continuous Delivery” in Rancher, deploys application workloads across multiple clusters. However, most applications need configuration and credentials. In Kubernetes, we store confidential information in secrets. For Fleet’s deployments to work on downstream clusters, we need to create these secrets on the downstream clusters themselves.
In this article, we will deploy a clustered Prometheus setup that integrates Thanos. It is resilient against node failures and ensures appropriate data archiving. The setup is also scalable. It can span multiple Kubernetes clusters under the same monitoring umbrella. Finally, we will visualize and monitor all our data in accessible and beautiful Grafana dashboards.
Have you heard about eBPF? It’s the technology that’s set to transform the Kubernetes landscape. In this article, we’ll explore what eBPF is and why it’s poised to become the next big thing in Kubernetes. But here’s the catch – despite its game-changing potential, it seems that few people are truly aware of its impact. Let’s delve into the details and discover why you should care.
The benefits of going cloud-native are far reaching: faster scaling, increased flexibility, and reduced infrastructure costs. According to Gartner®, “by 2027, more than 90% of global organizations will be running containerized applications in production, which is a significant increase from fewer than 40% in 2021.” Yet, while the adoption of containers and Kubernetes is growing, it comes with increased operational complexity, especially around monitoring and visibility.
In the grand tapestry of software engineering, our journey often winds through labyrinthine layers of application logic. Here, bugs play a compelling game of hide-and-seek, and features dance in an unpredictable ballet. During these instances of fervent exploration, we find ourselves longing for a reliable compass—a secret weapon—to help us decipher the riddles that lie ahead. Cue execution tags, our luminous lighthouse cutting through the dense fog of complexity.
If you are looking into the cloud-native world, then the chances of coming across the term “Kubernetes” is high. Kubernetes, also known as K8s, is an open-source system that has the primary responsibility of being a container orchestrator. This has quickly become a lifeline for managing our containerized applications through creating automated deployments.
This Kubernetes Architecture series covers the main components used in Kubernetes and provides an introduction to Kubernetes architecture. After reading these blogs, you’ll have a much deeper understanding of the main reasons for choosing Kubernetes as well as the main components that are involved when you start running applications on Kubernetes.
Rancher Desktop is equipped with convenient and powerful features that make it stand out as one of the best developer tools and the fastest ways to build and deploy Kubernetes locally. In this blog, we will tackle Rancher Desktop´s functionalities and features to guide you and help you take full advantage of all the benefits of using Rancher Desktop as a container management platform and for running local Kubernetes.
Bridging the gap between development and operations has become essential for the cultural shifts seen in organizations today. DevOps allows these concepts to be brought together, creating an influential blend of cultural philosophies, practices, and technological instruments, facilitating a quicker delivery of products and services. Throughout this blog, I will explore how we should all be embracing DevOps to allow our organizations to compete in an ever-changing digital world.
While Kubernetes comes with a number of benefits, it’s yet another piece of infrastructure that needs to be managed. Here, I’ll talk about three interesting ways that Honeycomb uses Honeycomb to get insight into our Kubernetes clusters. It’s worth calling out that we at Honeycomb use Amazon EKS to manage the control plane of our cluster, so this document will focus on monitoring Kubernetes as a consumer of a managed service.
With the growing popularity of Kubernetes as a container orchestration platform powering the microservices revolution, comes greater complexity with managing, monitoring, and responding to incidents at scale. Challenges with real production environments include full visibility into your clusters and environment’s health, alongside real-time incident management and response.
Kubernetes is the gold standard for container orchestration at scale. While massive global companies like Google, Spotify, and Pinterest rely on Kubernetes to run their software in production, so do many small but mighty developer teams. (Full disclosure: Honeycomb joined the Kubernetes brigade last year, when we migrated some of our services.)
18 million — that’s the number of developers around the world who use Docker, the popular tool for containerization. Docker Desktop, a software application for Mac, Windows, and Linux, is one of the most widely used tools within the Docker ecosystem, especially among developers who want to build, test, and deploy applications in containers on their local machines.
As we continue to see rapid technological advancements, organizations must evolve and adapt to maintain a competitive edge. The principles of DevOps - collaboration, automation, continuous integration, and delivery - have emerged as critical success factors in this landscape, enabling organizations to navigate the ever-changing environment.
In Kubernetes, the Domain Name System (DNS) plays a crucial role in enabling service discovery for pods to locate and communicate with other services within the cluster. This function is essential for managing the dynamic nature of Kubernetes environments and ensuring that applications can operate seamlessly. For organizations migrating their workloads to Kubernetes, it’s also important to establish connectivity with services outside the cluster.
June 7, 2023 It’s no secret that Kubernetes is one of the fastest-growing technologies in use today for deploying and operating applications of all types in the cloud. It’s also no secret that Kubernetes’ popularity is a significant contributor to fast-growing cloud bills. FinOps teams are constantly looking for ways to lower their cloud spend, in cooperation with the DevOps, Engineering and App owner teams that control this infrastructure.
Running a Kubernetes cluster isn’t easy. With all the benefits come complexities and unknowns. In order to truly understand your Kubernetes cluster and all the resources running inside, you need access to the treasure trove of telemetry that Kubernetes provides. With the right tools, you can get access to all the events, logs, and metrics of all the nodes, pods, containers, etc. running in your cluster. So which tool should you choose?
Rising container usage has fueled a growing reliance on container orchestration systems such as Kubernetes, EKS, and ECS. As organizations increasingly opt to run these systems in the cloud, their cloud spend tends not only to grow but also to become more opaque due to the dynamic complexity of these environments. Typically, various services, teams, and products share cluster resources, and as nodes are added and removed, those resources continuously shift.
Today, the cloud platform engineers are facing new challenges when running cloud native applications. Those applications are designed, deployed, maintained and monitored unlike traditional monolithic applications they are used to working with. Cloud native applications are designed and built to exploit the scale, elasticity, resiliency, and flexibility the cloud provides. They are a group of micro-services that are run in containers within a Kubernetes cluster and they all talk to each other.
In the complex world of Kubernetes, logs serve as the backbone of effective monitoring, debugging, and issue diagnosis. They provide indispensable insights into the behavior and performance of individual components within a Kubernetes cluster, such as containers, nodes, and services.
This Kubernetes Architecture series covers the main components used in Kubernetes and provides an introduction to Kubernetes architecture. After reading these blogs, you’ll have a much deeper understanding of the main reasons for choosing Kubernetes as well as the main components that are involved when you start running applications on Kubernetes. This blog series covers the following topics.
Kubernetes has created a major impact on modern software development because it is a powerful open source container orchestration platform that enables organizations to deploy and manage complex containerized applications at scale. In this blog, we will cover how Rancher Desktop can help developers run and manage Kubernetes locally.
AWS Fargate is a powerful tool for running containerized workloads on AWS. It’s a serverless compute engine that allows you to run containers and focus on developing and deploying your applications while AWS controls the cloud infrastructure. This can make a real difference for an organization, saving both time and resources that would otherwise go towards managing servers. This guide will discuss AWS Fargate pricing and provide tips for cost optimization.