Operations | Monitoring | ITSM | DevOps | Cloud

The latest News and Information on DevOps, CI/CD, Automation and related technologies.

Step-by-step Guide for Monitoring Redis Using Telegraf and MetricFire

Monitoring Redis instances is essential for maintaining performance, reliability, and security. It allows you to detect issues early, optimize resources, and provide a seamless experience for both developers and end-users. Monitoring your database allows you to track key performance metrics such as memory usage, CPU usage, and query response times. By analyzing these metrics, you can identify performance bottlenecks, optimize queries, and ensure that Redis is operating efficiently.
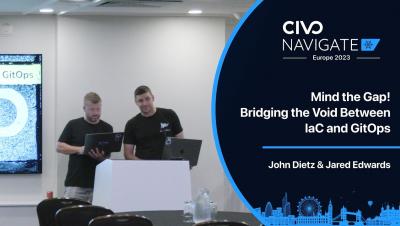
Transforming DevOps with IaC and GitOps - John Dietz & Jared Edwards - Navigate Europe 23

Join John Dietz and Jared Edwards as they navigate the transformative journey from Infrastructure as Code (IaC) to GitOps, emphasizing the pivotal role of Kubernetes. This talk offers an in-depth look at combining IaC practices with GitOps advantages for robust and efficient DevOps operations. Don't miss this workshop on tool integration, workflow management, and a live demo illustrating GitOps in action.

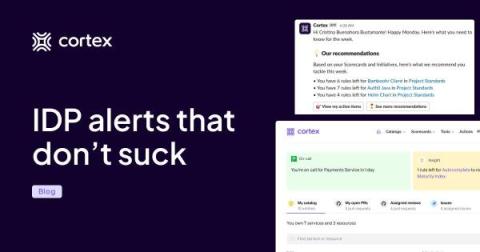
Cortex Notifications: Stay up to date while staying in flow

Notifications are designed to be annoying. Think of your phone buzzing in a quiet room: it demands your attention, lighting up your screen and making noise so you look at it. A notification is supposed to pull you away from whatever you’re working on. They can be useful, but they can also be a nuisance.

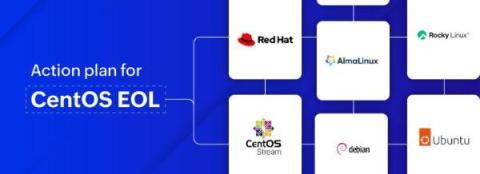
SysAdmin's guide to migrating from CentOS

CentOS EOL - Are you affected? CentOS used to be community driven. Imagine an OS being tested by a global community of volunteers against a testing team in a company—that gave CentOS unmatched stability. An OS that came with Securuty-Enhanced Linux (SELinux) by default and also included 10-year support meant it was the favorite of both individual developers and enterprises as well (even Facebook, now known as Meta, used CentOS for its data centers).

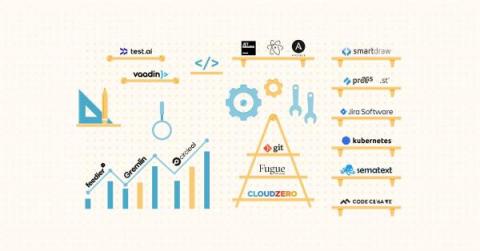
The 25 Most Crucial Software Engineering Tools In 2024

As a modern software engineer or CTO, you’re responsible for building, delivering, and maintaining high-quality software solutions at scale. Yet, software programs have grown increasingly complex over time, requiring meticulous work. The competition threatens to take your subscribers every billing cycle if you don’t constantly innovate, too. Customers want more, bigger, and better upgrades and updates.

Understanding Cardinality with Levitate's Cardinality Explorer

Predicting the future is hard, especially with metrics-based monitoring systems, because metrics cardinality can snowball. This is important because it affects query performance adversely. Having visibility into what’s happening now and workflows to manage cardinality is crucial. Because the answers depend on the quality of questions, a system allows you to ask. The questions one may have is —

Azure VM Autoscaling to enhance performance and cost efficiency

Azure VM Autoscaling is a feature provided by Microsoft Azure that allows to automatically adjust the number of Virtual Machines (VMs) in a specific scale set based on predefined criteria such as load, performance metrics, or a schedule. This post delves into the significance of autoscaling within Azure VMs, spotlighting its role in cost optimization, performance enhancement, and improved availability.

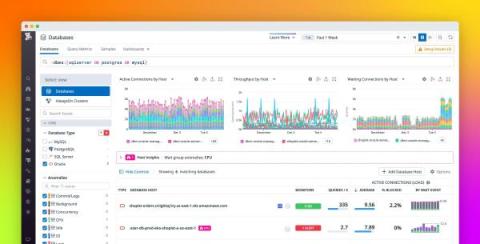
Monitor Oracle managed databases with Datadog DBM

Datadog Database Monitoring (DBM), which provides host-level and query performance metrics and insights for PostgreSQL, MySQL, and SQL Server, is now available for Oracle. Oracle is one of the most common database types, and now teams that operate Oracle databases can use Datadog to monitor these resources alongside telemetry from across their environments.