Operations | Monitoring | ITSM | DevOps | Cloud

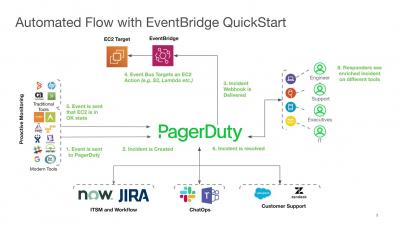
Why do you need to monitor VPNs?

A VPN connection comes in handy to establish a link between private servers and remote users. As a protected data path, the presence of the VPN tunnel paves the way for improved data security. Therefore, data transmissions between the network and device have the additional security of data encryption. But at the same time many inappropriate IPs can access your VPN, putting data security at stake. So, how do you deal with such situations? You definitely can’t stop using VPNs right.

Protect Servers with HAProxy Connection Limits and Queues

HAProxy connection limits and queues can help protect your servers and boost throughput when load balancing heavy amounts of traffic. When you use HAProxy as an API gateway in front of your services, it has the ability to protect those servers from traffic spikes. By utilizing connection limits and queues, you can ensure traffic flows through your network at an even pace.

[Webinar] - JFrog & AWS - Edge & Hybrid Software Distribution

Are you looking to migrate and modernize your infrastructure with AWS edge services? Do you need to distribute your software releases globally? JFrog and AWS have the answers to your hybrid infrastructure needs. JFrog will be hosting a webinar with Anuj Sharma, AWS Container Specialist Solution Architect, and Sven Ruppert, JFrog Developer Advocate.

You should be using Hosted Graphite for Heroku Metrics

Today, Heroku is used by many developers from a wide range of small to large enterprise size companies. As you are reading this article, you yourself may also be using Heroku to build and operate apps. So, how do you monitor the apps you run on Heroku? It is seen that many people are using Heroku metrics given its standard built-in feature and it being offered for free.

Multi-Cloud Strategy vs. Multi-Service: A Smarter Cloud Approach

Multi-cloud has become a hot-button topic these days, with a lot of cloud experts taking a strong stance against the practice. There are exceptions and legitimate reasons why you might choose a multi-cloud strategy (e.g., you sell to customers who restrict you from hosting their data in AWS). Extenuating circumstances aside, there are far more reasons why multi-cloud isn’t a good idea.

What the Big Brother Approach to IT Monitoring and Incident Management May Be Missing

We asked in a recent poll which popular TV show your IT team resembles the most. Big Brother came out on top, with almost 40% of respondents saying that their incident resolution process most resembled this show. Would you compare your incident management process to an episode of Big Brother? If so, it's likely that your IT environment is highly monitored, but incidents still seem to slip through the cracks.

A Two-Way Jira Speedway, the JFrog Artifactory App

The path between two clouds ought to be a speedy two-way street. That’s the DevOps pipeline principle behind the JFrog Artifactory App for Jira, which forges a traceable link between your issues in Jira Cloud and your builds in Artifactory on the JFrog DevOps Platform for cloud. Once the app for Jira has been installed you can: The JFrog Artifactory app, now available in Atlassian Marketplace, currently works with JFrog Platform cloud accounts and Atlassian cloud accounts.

Introducing Cloud SQL Insights

Cloud SQL Insights helps you detect, diagnose, and prevent query performance problems for Cloud SQL databases. With Insights, you can monitor performance at an application level and trace the source of a problematic query across the application stack by model, view, controller, route, user, and host. In this video, we introduce you to Cloud SQL Insights and demo how you can use it for self-service, intuitive monitoring and troubleshooting.

Delivering the "Interconnected Enterprise": Console Connect reveals how tech will drive business change in 2021

Console Connect & Applied Futurist study explores the enabling role of technology in creating frictionless interfaces, breaking down geographical barriers and accelerating the enterprise transition from monolith to ecosystem.

VirtualMetric stepped into a partnership with OCS Distribution, the leading broadline technology distributor in Russia

VirtualMetric, an all-in-one monitoring solution, announces a partnership with OCS Distribution, the leading broadline* technology distributor in Russia. This partnership will provide over 7000 resellers throughout Russia with access to the VirtualMetric monitoring suite. With over two decades of experience and 26 offices across Russia, OCS Distribution became one of the leading distributors in the Russian IT market.

Why managed open source?

Today, open source is everywhere. Across industries, more and more enterprise applications are created using open source components. The sprawling open source application estate brings its own set of challenges like dealing with multiple vendors, Day-N operations and issues around spiralling costs. But like any software, open source needs to be maintained. This video highlights why managed open source might be the solution for your team, and how Canonical and Ubuntu can help you reduce Total Cost of Ownership (TCO) with Managed Applications.

Introduction to Artifactory on the JFrog Platform

Everything you need to know about JFrog Artifactory: The how, the what, the where, and when to use Artifactory as part of your application delivery. At the heart of the JFrog DevOps Platform, Artifactory provides universal management for all binary artifacts, container images and Helm charts used throughout your SDLC. Learn how to use Artifactory, tips and tricks for improving your developer productivity and best practices for using Artifactory as part of your CI/CD pipelines to accelerate your releases.

Managing Compliance Drift: Break the endless scan-fix-drift cycle

In the first post of this series, we provided guidance for managing the many facets of a compliance program — taming the “compliance beast.” While there are many factors to consider, I’d argue that none is more essential than a reliable means of enforcement.

Is Alert Fatigue Hindering Your DevOps Work?

This year, you tell yourself, you are going to be prepared! You will arm yourself with a new status page, and create web monitoring for every important service in your arsenal. Like the proverbial Eye of Sauron, nothing will escape your omnipotence. But too many tools in your set can contribute to alert fatigue. Alert fatigue occurs when your team starts to feel like they are always on call. They might already secretly feel this way.

Monitoring vs Observability: Can You Tell The Difference?

Monitoring vs observability – is there even a difference and is your monitoring system observable? Observability has gained a lot of popularity in recent years. Modern DevOps paradigms encourage building robust applications by incorporating automation, Infrastructure as Code, and agile development. To assess the health and “robustness” of IT systems, engineering teams typically use logs, metrics, and traces, which are used by various developer tools to facilitate observability.

New Feature: Incident types

Incidents are inevitable, and the reality is some of them are inevitably going to repeat themselves. FireHydrant has always strived to make the entire incident response lifecycle smooth, but up until today, common incident types were slightly burdensome for our customers. We decided it was time to help people make it easy to declare incidents using easy-to-use templates, which we’re deeming Incident types.

Canonical & Kubernetes: 2020 highlights

Contact our Kubernetes team We’re now well into 2021, and as we plan ahead for our roadmap and activities around Kubernetes for the year, it helps to look back and reflect on everything that took place for Canonical in the K8s space within the year that passed. Kubernetes has always been a crucial part of Canonical’s vision and contribution to the IT world.

How to set AWS S3 Bucket Read Permissions with Relay

Cloud environments are susceptible to security issues. A big contributor is misconfigured resources. Misconfigured S3 buckets are one example of a security risk that could expose your organization’s sensitive data to bad actors. Policies and regular enforcement of best practices are key to reducing this security risk. However, manually checking and enforcing security is time-consuming and can fall behind with all the demands a busy DevOps team faces every day.

Our Groundbreaking Partnership with Docker Is a Boon for DevOps Teams

Today we’re announcing a big move that will yield substantial, concrete benefits for our customers and for the entire DevOps community: A groundbreaking partnership with Docker that exempts Cloud users of the JFrog Platform from Docker Hub’s image-pull rate limits. This agreement further boosts JFrog’s vibrant ecosystem of integration partners, built on the “too integrated to fail” principle that’s been a pillar of our company since its founding.

Distribute Software Releases Globally with JFrog on AWS

Release management is a topic that leaders in DevOps teams should be concerned with as organizations move toward implementing systems of automated continuous deployment. The practice will make your organization more efficient, but how do you implement it? Modernizing your infrastructure for the cloud is essential to distributing trusted releases globally. Many enterprises choose AWS as their platform, and seek to use AWS edge services to distribute their production applications to nearby end-points.

Introducing Cloud Cost Intelligence for Snowflake

Here at CloudZero, we work with some of the top software-driven companies out there. Like us, they’re building their products on Amazon Web Services (AWS), along with whatever best-of-breed providers meet their needs. It’s no secret that in recent years, Snowflake has seen — well, some serious success. For many companies, including CloudZero, they're the data warehouse provider of choice — and an essential component of delivering their products.

How to monitor your AWS servers via MetricFire

In this article we explore the basics of monitoring Amazon Web Services (AWS) by feeding metrics to Grafana through Hosted Graphite’s agent and also through Hosted Graphite’s AWS add-on. This will allow us to monitor metrics from applications and servers hosted in AWS with clarity and depth. This article assumes you have created a Hosted Graphite account.

Compute Confidently at the Edge with Rancher and Longhorn 1.1

Today’s announcement of Longhorn 1.1, a Cloud Native Computing Foundation (CNCF) Sandbox project, is exciting news for users of Rancher, SUSE’s Kubernetes management platform, and the Kubernetes community. Longhorn is an enterprise-grade, cloud native container storage solution that went GA in June 2020. Since then, adoption has increased by 235 percent.

What Is Interconnection And Why Is It So Important To Enterprises?

Enterprise network connectivity has evolved in line with changing business needs over the last few decades and as we saw with the sudden shift to remote working in 2020, the evolution cycle is speeding up in response to environmental change. This makes interconnection more important than ever to the modern enterprise.

Tyler Wells on building a culture of reliability at Twilio

What does reliability look like at a company that has thousands of employees and provides critical communication services to over 150,000 customers? We talked with Tyler Wells, Senior Director of Engineering at Twilio, to learn how he and his team created a culture of reliability at Twilio. He talked in depth about his experiences developing reliability goals, building reliability practices, and aligning engineering teams on these objectives.

Achieving the Observability Imperative Requires AI

The shift to Observability Over the last six months, unified monitoring, log management, and event management vendors have reoriented their technology portfolios (often without any change to the underlying functionality) towards Observability. In so doing, a fair amount of confusion has been generated in the market.

The Future of Kubernetes on DevOps Radio

In this episode of DevOps Radio, Shipa’s CEO and Founder Bruno Andrade joins host Brian Dawson to discuss his thoughts on the future of Kubernetes. DevOps Radio is a CloudBees-sponsored podcast series. Hosting experts from around the industry, the show dives into what it takes to successfully develop, deliver and deploy software in today’s ever-changing business environment. From DevOps to Docker, each episode features real-world insights and a few stories, tips, industry scoop and more.

How to build your own incident management process

IT incident management is a fundamental operational process designed to ensure rapid service restoration. This process is typically assigned to the help desk but is also very much entrenched in the day-to-day of DevOps. When incident management goes right, service is restored quickly and the impact on productivity, continuity, and customer satisfaction is minimal.

7 Tips On Building And Maintaining An SRE Team In Your Company

In today's "always on" world, Reliability is a primary business KPI. Plant the culture of Reliability by implementing these 7 simple tips to build a solid SRE team in your organization. Many of today’s hottest jobs didn’t exist at the turn of the millennium. Social media managers, data scientists, and growth hackers were never heard of before. Another relatively new job role in demand is that of a Site Reliability Engineer or SRE. The profession is quite new.

Take the first step toward SRE with Cloud Operations Sandbox

At Google Cloud, we strive to bring Site Reliability Engineering (SRE) culture to our customers not only through training on organizational best practices, but also with the tools you need to run successful cloud services. Part and parcel of that is comprehensive observability tooling—logging, monitoring, tracing, profiling and debugging—which can help you troubleshoot production issues faster, increase release velocity and improve service reliability.

Level Up 2020 Highlights

Hear from LogicMonitor leadership on some of the biggest announcements and additions to the LM product suite in 2020. We release an array of features that allow IT and Dev Ops teams to have full visibility into every corner their infrastructure, and with the addition of LM Logs we're on a mission to provide an extensible, fully unified observability platform.

Kelsey Hightower and Shipa for Kubernetes: A Fireside Chat

On October 22, 2020, Shipa launched a new web series called “Coffee & Containers.” C&C was conceived as a place for practitioners and IT leaders to learn and collaborate on all things microservices, cloud-native, containers, Kubernetes, etc. We were very proud to launch this series with Kelsey Hightower, Thought Leader and Developer Advocate at Google Cloud Platform, and Bruno Andrade, Founder and CEO of Shipa.io.

Taming the compliance beast: achieve efficiency & reliability at scale

Regulatory compliance is time-consuming and expensive. A recent survey of IT security professionals found that, on average, organizations must comply with 13 different regulations and spend an average of $3.5M annually on compliance activities, with audit-related activities consuming 232 person hours per year. With a team of five people, that adds up to 1.5 months a year devoted to audit-related activity. That’s a lot of hours that could have been spent on initiatives driving customer value.

Barriers to DevSecOps Adoption

DevSecOps — or the merging of Ops and Security — has been at the center of discussion for the better part of the outgoing decade. Today, the complexity of infrastructure change, demands security and DevOps teams to work together more efficiently. But there are hurdles to adoption of DevSecOps as a methodology. Cloud-native applications often live in multiple clouds across data centers, co-location, and public clouds.

Future of Monitoring: Experts Predictions for 2021 and Beyond

Making predictions is a tricky business at the best of times, but especially after a year that turned the world upside down. Even so, we have decided to talk to the IT leaders and discover what we should get ready for in 2021. With technology development, COVID-19 impact, and the new cybersecurity issues happening in the world, the IT engineers responsible for the IT infrastructure monitoring should be always ready to adapt to the new challenges.

Announcing HAProxy Kubernetes Ingress Controller 1.5

We’ve released version 1.5 of the HAProxy Kubernetes Ingress Controller. This version unlocks access to the raw HAProxy configuration language for power users to gain more control. You can also enable mutual TLS authentication between the ingress controller and services, enforce Basic authentication, and return custom error pages to users.

Set up a CI/CD Pipeline with Cloud-Native Tools

The adoption of cloud-based solutions has become increasingly common. The proof for this is evident – according to Gartner, Inc., the worldwide public cloud services market is expected to grow by 6.3% in 2020, up to a staggering $257.9 billion in value. The Flexera 2020 State of the Cloud Report, released on April 28, 2020, states that more than 90% of respondents have adopted cloud computing, with the top three cloud service providers being – AWS, Azure, and Google Cloud Platform.

JFrog & RedHat - Pizza Delivery vs. DevOps Pipeline On OpenShift

In this webinar, Baruch Sadogursky of JFrog and Aubrey Muhlach of Red Hat will demonstrate the ease of supporting DevOps with a fully-fledged pipeline in a cloud. From source control, CI server, artifact repository, security vulnerability and license compliance scanner, Docker registry, Helm repository... all the way to runtime, with OpenShift, tracing and monitoring tools. We mean EVERYTHING! So, by using the K.I.S.S. principle (keep it simple) applied to a bunch of SaaS tools, we can create an entire DevOps pipeline in 30 minutes or less! Or can’t we?

Feature spotlight: Auto Diff - New code vs Prod

When making changes to applications these days, it’s hard to understand and predict the impact of those changes before you deploy. API connections are multiplying, and with new cloud platforms such as containers/serverless, it only add to the complexity. Some people have trouble remembering whether they closed the garage door or turned off the coffee maker. Can you remember all the details of your latest API contract change? Let alone who would be impacted and needed to be notified?

A CSI Approach to Relationship-Based Observability

We recently ran a quick poll where we asked the audience, “When an IT incident occurs at your company, what TV show does it most resemble?” Twenty-three percent of respondents told us that CSI: Crime Scene Investigation resembled them the most. We needed to dig into that a little deeper. Let’s walk through the typical steps of figuring out the root cause, in CSI fashion: Photographs are critical in the world of CSI.

The New Age of Cloud Cost Management: Cloud Cost Intelligence (And 8 Best Practices)

As companies are increasingly built in the cloud, cost management has become a major issue for many engineering teams. While cloud providers like AWS offer flexibility and easy scaling, cloud costs can be opaque and difficult to track. As a result, many companies that rely on the cloud are adopting cloud cost management strategies to understand and manage the charges associated with their cloud-based technology, and maximize cloud usage and efficiency.

The Key Differences between SLI, SLO, and SLA in SRE

To incentivize reliability in your platform, there should be shared goals across your team to measure & quantify the capabilities of your product/service along with customer experience. Define the path of "Always-On" services by understanding few key SRE fundamentals and their implications - SLIs, SLOs & SLA. Framing SRE metrics for building or scaling a product is quite a daunting task.

How Service Providers Can Improve Network Performance in a Post-Pandemic World with Traffic Engineering

One thing that 2020 has clearly shown us is that communications services is a basic and fundamental driver of our global economy. During the COVID-19 pandemic, we realized that many tasks can be done at home, if access to communications services is sufficient. Many of us can work from home or other locations outside of the traditional office; students do not have to be physically present at school to participate in lectures; and we don’t need to go to movie theaters watch a new film release.

Trends in 2021 Dev-Led Landscape

Nowadays developers are in the driver’s seat regarding a lot of decisions for the tools they use. In this update from Tyler Jewell, he covers what he sees are the Top 5 trends that will take place this year. While it’s a bit of a crowded chart, he plots the companies that he sees driving these trends. If you drill into the Service Catalog trend, Jewell sees a couple of different groups working on ways to help developers deal with the deluge of Services (aka APIs).

2021 is the Year of Reliability

There’s no better time than now to dedicate effort to reliable software. If it wasn’t apparent before, this past year has made it more evident than ever: People expect their software tools to work every time, all the time. The shift in the way end-users think about software was as inevitable as our daily applications entered our lives, almost like water and electricity entered our homes.

How to collect HAProxy metrics

This article is a full tutorial on HAProxy monitoring and the best tools to get it done right. We will be looking into how to collect HAProxy metrics using a collectd daemon, push them into Graphite and visualize them in Grafana. To follow the steps in this blog, sign up for the MetricFire free trial, where you can use Graphite and Grafana directly in our platform.

I used Rust in production for 6 months! Here's my feedback

Are you in two minds when it comes to learning new programming languages? Probably you may feel the same when you first heard about Rust programming language. Good things require some effort and here's what I have to say after using Rust programming language in production for a 6-month duration – It is great and Simply superb! Let's get the clear practical experience picture with Rust at Qovery.

Discord Bot Part 1: Getting started the right way

I’ve recently started working on a new project to build a Discord bot in Go, mostly as a way to learn more Go but also so I can use it to manage various things in Azure and potentially elsewhere. I figured it’d be useful to document some of this project to give some insights as to what I’ve done and why. First up was setting up the CI/CD pipeline for it so that I don’t need to worry about it later and can save myself a bunch of time when testing.

Five Network Considerations For Remote Working

Many businesses put temporary measures in place last year to support remote working. With the shift to remote working appearing more long-term, businesses are now starting to think more strategically about how their networks can support a virtual workforce. Here we look at five network considerations to support your virtual workforce…

Coffee & Containers - Fireside Chat with Kelsey Hightower

We are very proud to launch this series with Kelsey Hightower, Thought Leader and Developer Advocate at Google Cloud Platform, and Bruno Andrade, Founder and CEO of Shipa.io. The topic of the conversation was focused on the current state of Kubernetes, and concluded with an "unboxing" and Kelsey's live/unfiltered impressions on the Shipa application management framework for Kubernetes.

Monitor datacenters and network devices with Datadog

Modern datacenters can contain thousands of network appliances, such as routers, switches, firewalls, and servers, so it’s important for your monitoring strategy to provide comprehensive visibility into every piece of your infrastructure. Datadog Network Device Monitoring already allows you to collect a wealth of telemetry from all of your SNMP-managed devices, which are automatically discovered by the Datadog Agent.

Datadog NPM now supports Istio networking

Istio is an open source service mesh that provides an abstraction layer for network traffic between applications, so you can run canary deployments, implement circuit breakers, and otherwise manage the architecture of your network using high-level configuration files. As service meshes become increasingly popular among containerized environments, dev and ops teams need to ensure that Istio is healthy, performant, and routing traffic as intended to keep their network infrastructure running smoothly.

Monitoring as code with Sensu Go 6

A comprehensive CI/CD initiative should include monitoring and observability. Monitoring as code incorporates the active monitoring of the infrastructure under management, creating a symbiotic relationship in which new metrics and failures are collected and detected automatically in response to code changes and new deployments. Monitoring as code is the key to this unified view of the world and management of the entire application lifecycle.

Introducing a New Pull Request Sidebar

Bitbucket Cloud’s pull request sidebar is useful because it displays all the relevant details of the pull request you’re looking at. However, with so much information present, it can be hard to find the information you need. To address feedback we’ve received about its readability and usability, we’ve given it a redesign.

Ribbon Rural Solutions

Ribbon is Ready to Help with Rural Broadband RDOF Funding? Secure & Trusted Act? COVID-19 Relief? Whatever the case, Ribbon is Ready. Ribbon has over 30 years of experience working with regional operators helping deploy rural services and much more. We can help you not only deliver the latest services your customers need but do so efficiently, effectively, and get you the most return on your time and monetary investments.

Monitor your NVIDIA Jetson IoT devices with Datadog

NVIDIA Jetson is a family of embedded, low-power computing boards designed to support machine learning and AI applications at the edge. Organizations use Jetson boards for complex video and image processing and analysis, automating build processes in factories, and improving city infrastructures. For example, Jetson-based devices enable cities to analyze traffic patterns with their existing traffic cameras in order to find ways to improve their most congested intersections.

Datadog automatically surfaces actionable insights into your Lambda functions

Serverless platforms like AWS Lambda have helped accelerate application development by removing the need to provision and manage infrastructure resources. However, serverless architecture presents new monitoring challenges. Because AWS Lambda handles underlying infrastructure for you, you don’t have access to system-level metrics. Instead, you have to monitor your Lambda functions for insight into their performance and resource usage.

Creating your first health alarm in Netdata

The per-second metrics and interactive visualizations in the Netdata Agent don’t mean much if you don’t know what you should be looking at, or whether anything is going wrong on your node in the first place. That’s why Netdata has a built-in health watchdog to notify you when metrics show an anomaly or full-blown incident that demands your immediate attention. Every Netdata Agent comes with hundreds of preconfigured charts that you don’t need to edit in order to take advantage of, but you may want to create your own based on your infrastructure, node, workload, or applications.

Telecom Review Leaders' Summit 2020 Panel Discussion - Wholesale and Capacity

The 14th Telecom Review Leaders' Summit 2020 Panel Discussion – Wholesale and Capacity: Managing the Explosion of Data Traffic discussion covers how the wholesale and capacity industry played a major role amid COVID-19, the impact of the pandemic on data traffic, challenges brought about by COVID-19 and more.

Why Cross-Domain Topology Seems Too Good To Be True

There are some things in life that seem too good to be true. So good, in fact, that they border on the edge of mythology. We see this often in the case of Cross-Domain Topology. Cross-Domain Topology ties together all the pieces of a hybrid, dynamic IT environment, so you can instantly see how changes impact your environment. It’s something that a lot of people didn’t even think was a possibility. While unicorns are myths, Cross-Domain Topology is very real. Here’s how it works.

Faster and safer application deployments on Kubernetes with Shipa and Oracle Kubernetes Engine (OKE)

Shipa’s application management framework, integrated into OKE, provides an out-of-the-box way for organizations to build, deploy and operate the full life-cycle of Kubernetes applications. With Shipa and OKE, organizations can make up for lost time and start getting value out of Kubernetes immediately. In this webcast, you will learn how Shipa and OKE.

Multi-cloud development is accelerating adoption of Kubernetes

As cloud infrastructure grows and develops, reliable and safe management of containers across multiple cloud providers grows increasingly important - accelerating the adoption of Kubernetes (K8s). Orchestration technologies like Kubernetes (K8s) automate the deployment and scaling of containers, and they also ensure the reliability of applications and workloads running on containers.

Integrating a Cloudsmith repository with a CircleCI pipeline

At Cloudsmith, we are proud of our partnership network. We work hard to collaborate and integrate with the best DevOps tools available. Building performant, modern workflows requires frictionless integrations between tooling. Integrating Cloudsmith repositories with your CI/CD processes facilitates rapid development. Build, test, and deploy/distribute your software in repeatable, performant ways.

Building, Testing and Deploying AWS Lambda Functions in Ruby

For quick, scalable, highly-available web services, few options compare to AWS Lambda. Just provide your code, add a little configuration, and you're done! In this article, Milap Neupane will introduce us to Lambda, show us how to get it working with Ruby and the Serverless Framework, and discuss reasons to use — or to not use! — Lambda in production.

Building w/ Observability- Honeycomb & CircleCI

Do you know exactly what your builds are doing at every step of the way to prod and after they’ve been deployed? A key part of what lets you ship code to production often and quickly is having observability in your builds. Together, CircleCI and Honeycomb can help you get both speed and quality when shipping code to production. In this webinar, we’ll not only examine how CircleCI and Honeycomb work well together, we’ll also look at how Honeycomb used both products together to identify changes that impacted their build times and reduced them by 25%.

A look back at 2020

2020 was, needless to say, not the best. Looking on the brighter side, in December, FireHydrant turned 2, and in spite of it all, we grew quite a bit. We raised our $8M Series A in May, our team grew nearly 4x in size, added some amazing features such as making FireHydrant Runbooks even more powerful with conditions, and great integrations, which you can find here. But even better, we got to work with all of you!

The True Cost of Building your Own Incident Management System (IMS)

Is your organization on the lookout for an incident management tool? If yes, you may wonder- am I better off building my own? Our latest blog outlines some of the key factors to consider while choosing whether to build or buy an incident management software.

Infrastructure Monitoring Challenges and How to Tackle Them

IT structures across organizations are bound to get complicated one way or another. If you’ve been in business for at least a decade, chances are you’ve acquired a complex, layered system of technology that’s a hodge-podge of old and new. This complexity brings new challenges for infrastructure monitoring. It goes without saying that any enterprise needs effective IT infrastructure monitoring. But when technology is evolving at the pace it is, things can get difficult.

CI/CD quick tip: Custom Slack message on code deployment

Notify Slack on deployment with a message customized for your team. This video walks you through how to create a Slack app, register a webhook, and use that webhook in your continuous delivery pipeline to send a custom message to Slack. If you don't want to do it yourself, try deployment notification in Sleuth. LINKS SLEUTH.

Integrating Grafana and CloudSQL

In this article, we are going to see how we can integrate Google Cloud with Grafana. We will integrate Google Cloud SQL with Grafana and plot the metrics on Grafana. We will also look at how we can use Google Stackdriver as the data source in Grafana to expose the metrics of Google Cloud VM’s and platforms. To use Grafana immediately, we will be using Hosted Grafana by MetricFire.

Graphite vs. InfluxDB

Both Graphite and InfluxDB are time-series monitoring data platforms, both of which have high levels of adoption throughout many industries. Both of them are suitable for enterprise use, are scalable, and are stable. That being said, there are some benefits and drawbacks to each. While InfluxDB has many benefits, many developers still prefer Graphite due to its large community, stability, and reliability.

Save Time and Money by Automatically Deleting Unused Azure Load Balancers

Using the cloud reduces on-premises infrastructure costs and related maintenance. Instead of deploying more servers, storage, and networking components to your own datacenter, you are now deploying these as cloud resources. Using the cloud is supposed to reduce infrastructure and maintenance costs. However, deploying cloud resources also risks over-commissioning, under-usage, and keeping resources running that are not always needed or, even worse, no longer in use.

Handling failures when deploying to multiple databases with SQL Change Automation

How do you handle deployment failures with a single-tenant database architecture? We’ve had a question come up from a couple of customers regarding an interesting use case with Redgate’s SQL Change Automation. In this scenario, customers say: A natural question that arises is what to do when a deployment fails against a single database. For example: One approach that seems simplest to folks is wrapping the entire multi-database deployment into a single transaction.

Building and Scaling Your SRE Team

Building Site Reliability Engineering (SRE) teams is hard! There are so many articles and explanations of what SRE means, it’s easy to get lost. Going beyond understanding what the individual SRE role is into building and scaling a team of SREs is more of a challenge. It’s important to find the right information that will help you take your SRE team to the next level.

What is virtualization technology?

Although it is not well known to the general public, virtualization technology is widely used in technical environments for being useful when carrying out multiple tasks and for the possibilities it offers for better resource usage. Virtualization technology software is increasingly used by professionals in the sector, having already become an essential tool for the work of many of them.

It's code! Synthetic monitoring with Terraform Cloud & Checkly

How does one manage monitoring in the age of digital infrastructure as code? Also as code, of course! Combining HashiCorp Terraform Cloud and Checkly enables you to configure synthetic and API monitoring as part of your existing infrastructure codebase. It is flexible, programmable and will keep you out of maintenance hell, even at scale: it is monitoring for developers. Extending your existing Terraform Cloud configuration takes only two minutes. Let's take a look together.

PostgreSQL security: The PgMiner botnet attacks explained

Assuring the security of PostgreSQL and all open source database systems is critical as many learned with the PgMiner botnet attacks in December 2020. Having an understanding of, and visibility into, how these attacks happen and following standard best practices is the best way to make sure that your data is not at risk. This blog details the latest security issue with PostgreSQL, how to fix/prevent these attacks and how to ensure security of your PostgreSQL database instances.

The Year DevOps Leaped to the Center

At the beginning of 2020, none of us could have imagined what we would be talking and thinking about at the end of the year. At JFrog, we began by talking about unifying everything in the DevOps lifecycle. Of course very quickly, the message of unity and togetherness would soon become even bigger than we could imagine in light of the global pandemic.

DevOps Challenge - Kubernetes Deployment: Ketch vs YAML

Ketch (https://www.theketch.io) is an open-source application delivery framework for Kubernetes. YAML is a human-readable data-serialization language. It is commonly used for configuration files and in applications where data is being stored or transmitted. Customized YAML files are used by many for the complicated task of deploying to Kubernetes.

How to Enable a Hardware Virtualization

Hardware virtualization, also known as hardware assisted virtualization, is the creation of virtual versions of operating systems and computers. The technology was made by AMD and Intel for their server platforms. Its purpose was to improve the processor’s performance and meet virtualization challenges such as translating memory addresses and instructions. Many IT businesses have deployed servers that run only at a fraction of their total capacity.

AWS Cost Optimization: A Guide To Managing Your AWS Bill

For developers and programmers, Amazon Web Services (AWS) offers many benefits. It gives you access to the computing and DevOps tools you need at the press of a button — which helps you get products out the door fast. However, it can be challenging to control your costs and identify waste. In this comprehensive guide, we will examine some practical steps you can take for AWS cost optimization.

Better incident management while working remotely: The Squadcast way

As the pandemic wears on, remote incident management has become the norm worldwide for businesses. Here we share some best practices that helped us to address remote incidents and make on-call less stressful. With the onset of remote work due to Covid-19, remote incident management has become the norm for businesses worldwide. Organisations that were earlier used to having war rooms now find themselves having to coordinate teams through Slack, MS Teams or other collaboration tools.

Four key metrics for responding to IT incidents and failures

If you’re a veteran in this space, you probably understand the many incident response metrics and concepts, along with the many (at times exasperating) acronyms. For those new to the space, or even those with years of experience, the terminology is often overwhelming. If you’re one of those people who’s struggling to navigate through the world of DevOps metrics, we’ve created this article for you.

Innovation Insight for Observability by Gartner

In its latest report, research firm Gartner tackles the trending subject of Observability. According to Gartner, "Observability is the evolution of monitoring into a process that offers insight into digital business applications, speeds innovation and enhances customer experience. I&O leaders should use observability to extend current monitoring capabilities, processes, and culture to deliver these benefits." This blog post gives you a sneak-peek of this new analyst report about observability.

Simply the Best: JFrog's Top DevOps Articles from 2020

In 2020, JFrog’s experts published a treasure trove of content — blogs, articles, infographics, and more — to share insights and advice with our customers and the DevOps community at large. In case you missed them — or want to re-read them — here’s a list of the most popular ones. They range from a primer on container registries to an explainer on achieving high-availability for your Maven repository.

Deploying applications to Kubernetes from your CI pipeline

Now that we know the advantages of leveraging Ketch over other tools such as Helm to ease the deployment of our applications (BLOG: Helm vs. Ketch when Deploying Applications), a good next step is for us to understand how we can tie Ketch to our CI pipeline and have an automated deployment process. For this example, we will leverage Ketch, GitHub Actions, and a Kubernetes cluster on Google Kubernetes Engine (GKE).

How to Expose and protect Logic App using Azure API Management (Part 5) - API operation documentation: Tags and Headers (Part 2)

There is no doubt that organizations have a difficult task to address the current requirements for building and managing APIs, especially if they don’t use tools like API Management. APIs require up-to-date and strong documentation, increased security levels, comprehensive testing, routine versioning, and high-reliability to be appropriately utilized.

G2 Recognizes Squadcast as Momentum Leader in Incident Management

We are thrilled to begin the year on a high note! Squadcast has been awarded in the Incident management and IT Alerting category in G2's Winter Report 2021 for below categories. ‍‍ “We are honoured to be recognised as a Momentum Leader in the IT Incident management category by G2. We have always strived to create the fastest and easiest Incident Response experience for Engineering and DevOps teams that enables organisations to better monitor their IT infrastructure and applications.

Start and Stop DocumentDB Clusters Actions

Amazon DocumentDB is a managed MongoDB-compatible database service provided by AWS. It provides the database in clusters, with multiple instances, for high-availablity. To help with cost-reduction strategies, AWS allows DocumentDB clusters to be stopped and restarted. While the cluster is stopped, you’re not charged. So it’s a great candidate to shut off overnight and on weekends if it’s not needed.

OpenStack for telcos by Canonical

OpenStack has been around for a good while now, and many of us associate it with the period of IT technology’s initial transition from individual appliance implementation on hardware, to cloud compute and virtualisation. And yet in 2020 we cannot skip this topic when talking telco infrastructure. So how is OpenStack still pertinent to telco organisations, and what in broad terms is new and exciting or worth discussing today about OpenStack?

10 Tools That Make IT Specialist's Life Easier

As an IT specialist, you should have an aptitude for all the essential tools vital for the efficient running of IT infrastructure. These software programs designed for their specific purposes basically serve the same purpose as an engineer’s toolkit. They make it easy to get the job done, and on top of that, get it done well. Depending on your job, you may or may not need to use all the tools. But as an IT professional, you should know which tool can help you with which task.

Circuit Breaking in HAProxy

With HAProxy, you can implement a circuit breaker to protect services from widespread failure. Martin Fowler, who is famous for being one of the Gang of Four authors who wrote Design Patterns: Elements of Reusable Object-Oriented Software, hosts a website where he catalogues software design patterns. He defines the Circuit Breaker pattern like this: The basic idea behind the circuit breaker is very simple. You wrap a protected function call in a circuit breaker object, which monitors for failures.

What unique technical value does Redgate's Database DevOps solution provide?

Why a GitHub account or an Azure DevOps subscription isn't enough to implement database DevOps. A colleague recently relayed a great question from the community: why isn’t a hosted development, collaboration, and automation environment such as Azure DevOps enough by itself to implement Database DevOps? In short, generalized DevOps development and automation tooling does an excellent job at hosting version control repositories and at enabling automation.

Find the Path to Go Module Major Versions With GoCenter

How many major versions of a given Go module are there? That simple question doesn’t always have an easy-to-discover answer. Golang’s unique system of semantic import versioning solves some key problems of ensuring Go module compatibility across dependencies. But it also makes it a bit harder to learn what major versions of a Go module are available. The go client doesn’t provide a way to find out, nor will it inform you when a newer major version of a dependency exists.

Incident Ready: How to Chaos Engineer Your Incident Response Process - FireHydrant

We’re pretty sure using a real incident to test a new response process is not the best idea. So, how do you test your process ahead of time? In this video, FireHydrant CEO, Robert Ross, will share how FireHydrant customers leverage best practices to break, mitigate, resolve, and fireproof incident processes. We’ll show you how to use chaos engineering philosophies to stress test 3 critical parts of a great process.

Hacked! Solve the Dreaded DevOps Problem With This

Hacks that make headlines are painful for everyone involved, but with some clever preparation and web monitoring at your side you can avoid the worst of this pain. Those who have been victimized face a steep uphill battle to reclaim trust and authority. Unwitting victims, like customers and end users, suffer downtime or leaks containing personally identifiable information. If your eye is not on security, your organization is inviting these kinds of attacks.

Improve M&A success rates by testing for system reliability

Get started with Gremlin's Chaos Engineering tools to safely, securely, and simply inject failure into your systems to find weaknesses before they cause customer-facing issues. Coming out of recessions, merger and acquisition volume typically picks up as lower interest rates drop the cost of capital and Corporate Development teams begin executing on the strategies they’ve developed during the holding periods. This year has been no exception, with $350 billion spent on tech acquisitions to date.

5 Ways To Align Your Business With The New Interconnected Enterprise Model

Enterprise operations are becoming increasingly complex ecosystems, involving new technologies, larger supply chains and more partners than ever before. In a new report called ‘Building Tomorrow’s Interconnected Enterprise’, Console Connect and Applied Futurist Tom Cheesewright present a new interconnected enterprise model for the ecosystem-based future, where successful organisations will operate as a complex web of interactions rather than a monolithic whole.

Building a great engineering team starts with hiring

...but it doesn't end there. Once you've hired the best, keeping them engaged, motivated, and working well with each other is an ongoing challenge. In this ebook, you'll hear from some of our top technical leaders about the techniques and principles we've spent years honing. Growing a technical company requires more than great technical leadership-it requires thoughtful, compassionate, and expert people leadership as well. Download this ebook today, and help your team thrive.