Operations | Monitoring | ITSM | DevOps | Cloud

The latest News and Information on DevOps, CI/CD, Automation and related technologies.

How to view the size of all your Azure Storage Accounts and Blobs

As more and more organisations dive into Azure, storage consumption continues to grow and so does the cost to businesses. Azure offers almost a limitless supply of storage, but this comes at a cost so it’s important to know exactly where that storage is going. There are a few ways to get this information, either via the Azure portal, Azure Storage Explorer or even PowerShell. However, all these tools have limitations and to be honest, rather lacking and not that straightforward.
Shipping Metrics from Hashicorp Consul with ELK and Logz.io

Microservices interact in so many ways. Load balancers, security authentication, and service discovery are just the tip of the iceberg. It can get confusing, if not outright messy. But why be messy when you can be meshy? This is where service meshes come into play, linking the roles these tools have in a common ‘net’ that ties and weaves the whole architecture together. Hashicorp has produced one of the most popular of these organizational assets — Consul Connect.

Introducing Boolean-filtered metric queries

Health and performance issues are easier to understand—and to troubleshoot—when you can use tags to aggregate your data across many overlapping scopes. But while some scopes come directly from your infrastructure, others are constantly evolving to reflect the needs of your product or organization. You can only track your data effectively if you can define—and redefine—your scopes on the fly.

Manage Your Splunk Infrastructure as Code Using Terraform

Splunk is happy to announce that we now have a Hashicorp verified Terraform Provider for Splunk. The provider is publicly available in the Terraform Registry and can be used by referencing it in your Terraform configuration file and simply executing terraform init. If you're new to Terraform and Providers, the latest version of Terraform is available here. You will need to download the appropriate binaries and have Terraform installed before using the provider.

Today's Big Leap for Tomorrow

Today is a momentous day for JFrog, as we’re excited and proud to join the Nasdaq family of listings. While COVID-19 challenges every company and prevents us from being together in many ways, we’re humbled that Times Square was turned green today! This is obviously an important milestone, and it couldn’t have happened without over a decade of hard work and millions of hours that have gone into this amazing company.

Reimagine All You Have Learned: APM and the Skills Gap

APM tools have been formerly and primarily siloed in the application development arena, with only the most important and mission-critical applications having their APM instrumentation extended into production use due to complexity and cost. In the modern world of application monitoring, the requirements for Dev and Ops need to be tightly integrated.

Monitor Your Azure VM's Using Event Grid and Logic Apps

With the accelerated pace of digital transformation, DevOps, adoption of new platforms, and also managing cloud resources are becoming increasingly challenging for central IT. Applying available best practices, compliance requirements and cost management are adding to the challenge. With the Serverless technologies, customers can apply such policies to cloud resources and run them over a long time.

Introducing our first Netdata Cloud Insights feature: Metric Correlations for faster root cause analysis

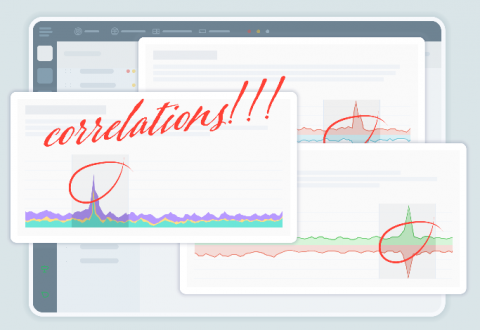
Today, we are excited to launch our first Netdata Cloud Insights feature, Metric Correlations, developed for discovering underlying issues more quickly and identifying the root cause more efficiently. Read on to learn more about our approach to developing this new feature, how it works, and the many benefits you’ll find incorporating this into your team’s troubleshooting workflow.

Netdata versus Datadog: root cause analysis with metric correlations

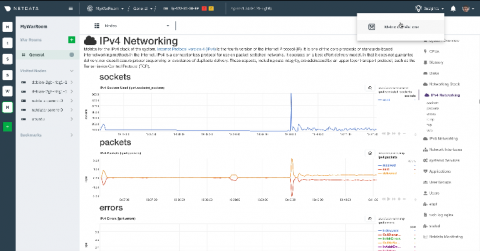
When an incident strikes, and every minute spent on root cause analysis delays the time to resolution, the real-world consequences can be dire. Troubleshooting an event requires a certain data set: every metric, at the greatest granularity, in one place, available in real time. Limits on the number or type of metrics, collection frequency, or time to visualization can mean the difference between timely resolution and unacceptable losses in time, money, and productivity.