Operations | Monitoring | ITSM | DevOps | Cloud

How Can You Optimize Business Cost and Performance With Observability?

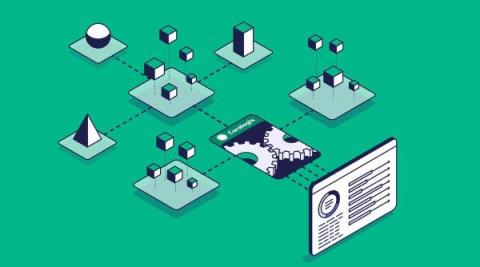
Businesses are increasingly adopting distributed microservices to build and deploy applications. Microservices directly streamline the production time from development to deployment; thus, businesses can scale faster. However, with the increasing complexity of distributed services comes visual opacity of your systems across the company. In other words, the more complex your system gets, the harder it becomes to visualize how it works and how individual resources are allocated.

Importing your Cloudwatch Metrics into Prometheus

Cloudwatch is the de facto method of consuming logs and metrics from your AWS infrastructure. The problem is, it is not the de facto method of capturing metrics for your applications. This creates two places where observability is stored, and can make it difficult to understand the true state of your system. That’s why it has become common to unify all data into one place, and Prometheus offers an open-source, vendor-agnostic solution to that problem.

Connecting OpenTelemetry to AWS Fargate

OpenTelemetry is an open-source observability framework that provides a vendor-neutral and language-agnostic way to collect and analyze telemetry data. This tutorial will show you how to integrate OpenTelemetry with Amazon AWS Fargate, a container orchestration service that allows you to run and scale containerized applications without managing the underlying infrastructure.