New release: SquaredUp 5.3
SquaredUp 5.3 is now available! You will find new features to discover as well as enhancements to the SquaredUp you already love. Here are the highlights: Check out our release webinar for a detailed walkthrough and demo.


SquaredUp 5.3 is now available! You will find new features to discover as well as enhancements to the SquaredUp you already love. Here are the highlights: Check out our release webinar for a detailed walkthrough and demo.
We are excited to announce a new community initiative – Dashboard Fridays. Dashboard Fridays is a bite-sized video series where we share and discuss a range of different dashboards created for the community, by the community. Each video is no longer than 20min, so grab a coffee and let’s talk dashboards! Each episode, we will zoom in on one stellar dashboard put together by a member of the community.
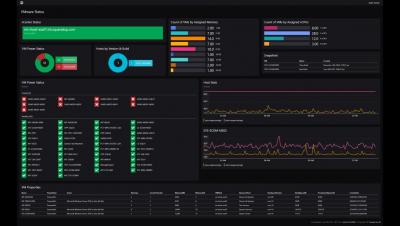
SquaredUp recently launched a PowerShell tile that lets you visualize data returned from a PowerShell script. This has opened virtually infinite doors to the sources you can get data from. PowerShell can work with crazy text formats obscure databases, and endpoints that are open on the internet. If you can access it, PowerShell can work with it. And SquaredUp lets you leverage that power so you can get the information you need and visualize it in a format that makes sense.
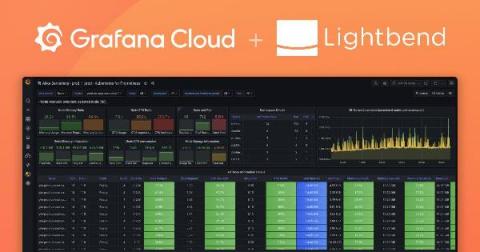
When top companies have needed platforms for their demanding, globally distributed, cloud native application environments and streaming data pipelines, they’ve turned to Akka, the most popular implementation of the Actor Model for cloud native applications running on Kubernetes. The company behind Akka is Lightbend, a leader in the world of cloud native applications and architectures.
Not so long ago, development teams working for the U.S. Department of Defense could take anywhere from three to ten years to deliver software. “It was mostly teams using waterfall, no minimum viable product, no incremental delivery, and no feedback loop from end users,” Nicolas M. Chaillan, Chief Software Officer of the U.S. Air Force, said in a CNCF case study. “Particularly when it comes to AI, machine learning, and cybersecurity, everyone realized we have to move faster.”
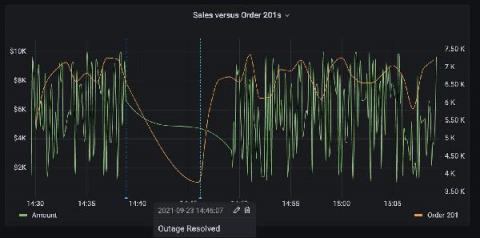
Good news for Salesforce users: With the new Salesforce plugin for Grafana, available now with an Enterprise license, you can instantly visualize your SFDC data in Grafana dashboards. Plus, Grafana allows you to visualize the Salesforce data alongside all sorts of other data. One interesting use case is correlating sales data to system metrics and logs, which would be valuable if your company uses any software systems at all to help generate revenue.
We are pleased to announce the beta launch of hosted Grafana in addition to our existing ELK as a Service & hosted Open Distro services. As organisations around the world are constantly looking for ways that they can ensure compliance is being upheld, speeding up Mean Time To Repair (MTTR) and reducing the risk of DDoS attacks, managed Grafana forms a vital role in improving metrics observability across the entirety of your infrastructure.