Operations | Monitoring | ITSM | DevOps | Cloud

How Does a Telemetry Pipeline Work?

Telemetry passes through several stages before anyone can use it. Searching it, charting it, and alerting on it all come later. Each stage makes one decision about the data. Their order separates a pipeline that saves money from one that adds a hop. Most teams meet this layer late, usually after a monitoring bill jumps. Here is how a telemetry pipeline works, stage by stage: By the end you can map your own telemetry flow against the five stages, and see which one is costing you.

What Backup Monitoring Software Should Track to Protect RTO and RPO

How many backup jobs completed successfully in your environment last night, and how many of those systems could you bring back inside the window the business agreed to? Most backup consoles answer the first question well. They report job status, completion time and volume written, then roll it into a reassuring compliance summary. The second question needs different evidence, usually missing from that screen. The distance between those answers shows up during the recovery attempt.

A Practical ClickHouse Monitoring Guide Built Around Failure Modes

Why does a ClickHouse cluster report every node as healthy while inserts start failing and dashboards go stale? Most often the failing subsystem was never represented in the metrics anyone had on screen. A node answers its health check while its replication queue has been growing for hours. ClickHouse breaks in specific, repeatable ways. Parts accumulate faster than background merges can consolidate them. Coordination drops quorum and every replicated table quietly turns read-only.

How Network Documentation Software Keeps Network Diagrams Current

When did anyone last open your network diagram and trust what it showed? A diagram drawn in a static drawing tool is accurate on the day it is saved. One quarter, two circuit upgrades and a hardware refresh later, it describes a network that no longer exists. Nothing warns you that this has happened. The file still opens, still prints, and still gets attached to change requests, which is what makes it risky during an incident.

Storage Monitoring Tools and the KPIs Behind Each Failure Domain

When an application slows down, how long does it take to confirm whether storage caused it? The answer depends entirely on whether anything is collecting from the array itself. The server dashboard reports healthy CPU and memory, the network graphs look clean, and the array holding the data says nothing at all. Storage failures announce themselves late.

How to Monitor Docker Containers You Cannot Rebuild or Redeploy

How long would it take you to get one new line of code into the container running your payment service? In a lot of organizations, the answer runs to weeks, because the change has to clear a build owner, a test cycle, and a release window that nobody wants to open early. That timeline is why so much monitoring advice fails on contact. Most of it opens by telling you to add a library, rebuild the image, and push a new version. If you could do that this afternoon, you would have done it already.

How eBPF Observability Monitors Docker Containers Without a Rebuild

How many containers are running in your production environment right now that nobody can see inside? A vendored service, a compiled binary, an application whose build pipeline left with the developer who wrote it: each one runs, serves traffic, and reports nothing. Instrumenting those workloads means a code change, a rebuild, and a redeploy, and on these containers none of the three are available.

10 Best Session Replay Software & Tools for 2026

Some frontend bugs never get fixed because nobody can prove they happened. The user cannot describe what they clicked, and the error log shows nothing. The best session replay software closes that gap by rebuilding the visit itself. If you want the mechanics first, our guide to what session replay is covers how the recording is built and played back. Choosing between the tools is the harder part, because three very different kinds of product now sell the same feature.

A Practical Guide to Core Web Vitals Optimization for Better UX and Faster Conversions

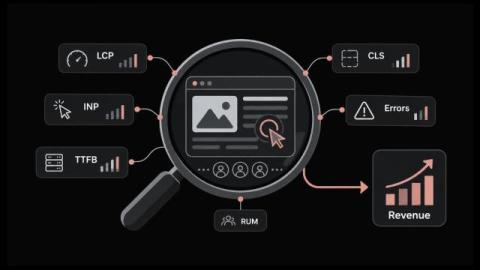
When a page starts losing customers, how long does it take to find out which one? The evidence lives in your visitors' browsers, and standard infrastructure tooling measures servers instead. A speed test run from an office machine answers a different question entirely. Pages that clear every internal check can still turn away a quarter of the people who reach them.

10 Best Real User Monitoring Tools Compared for 2026

Most IT teams learn their application feels slow when a customer complains. Server metrics never measure what a person on a phone waits for. The best real user monitoring tools close that gap by collecting timings from your users' browsers. Choosing one got harder this year, because the measurement standard moved. In this blog, we compare the best tools for real user monitoring, including their pros, cons, and key features. By the end you will know which one fits your stack.