Netdata v1.43.0 Release Meetup
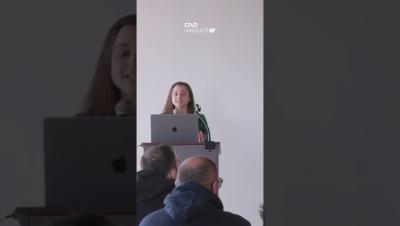
Join Costas Tsaousis, Founder & CEO; and the Netdata Product team, on the 18th of October at 15:30 UTC for the Netdata Release Meetup, which will be held on Netdata's Youtube channel.


The latest News and Information on DevOps, CI/CD, Automation and related technologies.
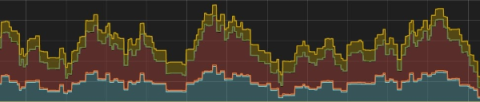
Monitoring the performance and health of web applications is paramount for ensuring a seamless user experience. Flask offers developers the flexibility to build dynamic applications. However, as applications grow in complexity, so does the need for efficient monitoring solutions. This is where Grafana and Graphite come into play.
Most IT firms build their empire on Kubernetes, for its amazing flexibility and super scalability. RedHat OpenShift Container Platform (formerly OpenShift Enterprise) is a hybrid cloud application platform powered by Kubernetes, which initially only operated on-premise, and has been open to service for more than nine years.
Prometheus is a very popular open-source monitoring and alerting toolkit originally built in 2012. Its main focus is to provide valid insight into system performance by providing a way for certain variables of that system to be monitored. Prometheus displays the performance of these variables as a graph to allow its users to see their system’s performance at a glance.
Microsoft Office 365, often simply referred to as Office 365, represents a significant shift in the way we approach work in a digital environment. It’s a subscription service that ensures you always have the most up-to-date modern productivity tools from Microsoft. This suite of services and applications goes beyond the traditional software suite to offer a wide range of tools and solutions to modern-day challenges faced by organizations and individuals alike.