The latest News and Information on DevOps, CI/CD, Automation and related technologies.
In this article, we will look at how to monitor Node.js applications using Graphite and StatsD and plot the visualizations on a Grafana dashboard. Node.js is a popular framework for creating microservices. Its asynchronous nature allows for high scalability and low latency, especially for I/O bound tasks. However, it is important to have a proper monitoring setup for any application which is running in a production environment.
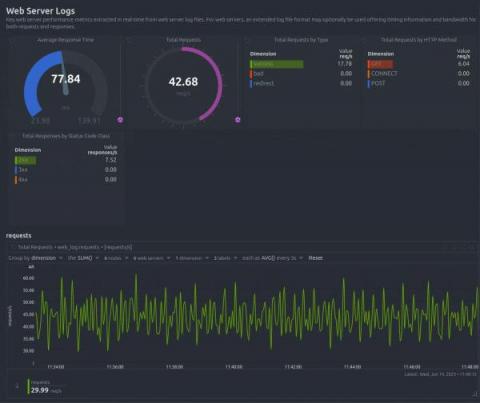
Another release of the Netdata Monitoring solution is here!
If you are looking into the cloud-native world, then the chances of coming across the term “Kubernetes” is high. Kubernetes, also known as K8s, is an open-source system that has the primary responsibility of being a container orchestrator. This has quickly become a lifeline for managing our containerized applications through creating automated deployments.
In the realm of virtualization and cloud computing, VMware has been a leading name for years, offering robust and innovative solutions to businesses of all sizes. Their products have transformed the way organizations manage their IT infrastructure, enabling them to create flexible, scalable, and secure virtual environments. On March 18, 2023, VMware introduced the latest version of their flagship product, VMware vSphere 8.0.
We’ve all been there. You’re working through some rather frustrating blockers during an incident only to discover that you don’t own the dependency at fault. Or, you’ve been pounding away at an issue when a fellow engineer reaches out and asks if your service is affected by some particularly gnarly database failure they’re seeing. But then what? Do you merge efforts and work in parallel or head for a coffee break while the issue gets attacked upstream?