Operations | Monitoring | ITSM | DevOps | Cloud

Grafana Campfire - Assistant powered Dynamic dashboards - (Grafana Community Call - August 2026)

Many times, it feels like you're maintaining multiple versions of the same dashboard (with a slight modification), *OR* simply spending more time writing queries rather than actually looking at the actual data? In this Campfire community call, we're taking a deep dive into two things that are reshaping how Grafana dashboards get built: Dynamic Dashboards and the Grafana AI Assistant and showing you how to combine them to go from a blank canvas to a reusable, production-ready dashboard in minutes.

How to scale Alloy as a central telemetry gateway: capacity planning, load testing, and production lessons

Running Alloy as a single-instance sidecar is simple. Running it as a centralized gateway that absorbs the full telemetry stream of an enterprise platform—tens of millions of active series, terabytes of logs per day, and tens of thousands of trace spans per second—is a different challenge altogether. To get it right, you need deliberate capacity planning, honest load testing, and a monitoring setup that doesn't rely on the very thing you're testing.

When to Use Grafana Assistant vs. MCP vs. gcx: Part 3

When should you use gcx? If Grafana Assistant is the brain and Grafana MCP is the easy hand, gcx is the power hand. Built for AI agents working in the terminal, gcx gives them deep access across Grafana Cloud—so they can pull telemetry, verify code, automate workflows, and access places MCP doesn’t. Coding agents? gcx. Need the full Grafana Cloud surface? gcx. Automating in CI/CD? gcx. Here’s where it fits, and when to use it — explained by Nicole van der Hoeven.

Grafana 13.2 release: easier ways to query and explore your data

Grafana 13.2 is here, bringing more improvements to help you and your team explore your data and get to insights faster. Download Grafana 13.2 In this post, we’ll highlight the latest updates to saved queries, a feature that lets teams share, discover, and reuse queries to get to trusted answers faster and help new teammates get up to speed. We’ll also explore how the new View panel sidebar makes exploring busy panels a breeze.

Knowledge Graph as context for LLMs: demonstrating decisive RCA and faster production performance

On the product team here at Grafana Labs, we consider AI agents our users, too. That’s why we set out to test how well agents can debug incidents across the full stack, and how much better they perform with Grafana Cloud’s Knowledge Graph vs. using raw telemetry alone. Our early results are promising. In one real incident we replayed 16 times each way, an agent with Knowledge Graph context found the correct root cause 15 times, compared with just once using raw telemetry alone.

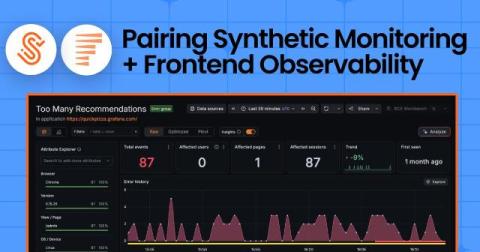
From failed check to real user impact: Pairing Synthetic Monitoring and Frontend Observability in Grafana Cloud

Say you get a support escalation about a page in the app that won’t load. But when you pull up your synthetic checks, they're all green: 100% uptime, probes are passing. Something's not adding up, but which one do you trust? If you’ve run Grafana Cloud Synthetic Monitoring, you’ve been on both sides of this. Sometimes it's the ticket: real users hit a wall on the path but your checks pass cleanly. Other times, it’s the inverse.

When to Use Grafana Assistant vs. MCP vs. GCX: Part 2

When should you reach for Grafana MCP? It’s one of the two “hands” in Grafana’s AI toolkit — and the easy one at that. MCP lets you bring Grafana into the tools you already use, like ChatGPT, Claude, or Cursor, without changing your workflow. No terminal? MCP. Want to stick with your favorite AI tool? MCP. Want easy tool discovery out of the box? MCP. Here’s where it fits, and when to use it — explained by Nicole van der Hoeven.

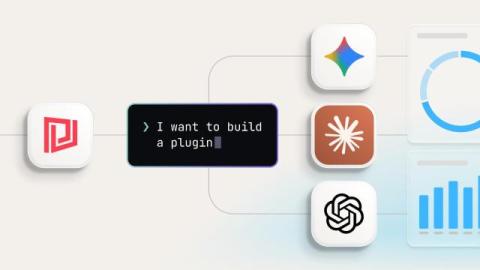
Introducing the AI toolkit - build a SquaredUp plugin from a single prompt

When we introduced the Low Code Plugin (LCP) framework in February, the premise was simple: if a system has an API, you should be able to build a plugin for it — quickly, with minimal code, and in a way you can share with the community. The "AI-ready" part was deliberate. The framework was designed to work naturally with AI assistants, so the path from idea to working integration would be as short as possible. That design decision is now paying off.

Getting started with Microsoft Purview dashboards

Microsoft Purview is an enterprise-scale platform for managing data governance across your whole cloud estate. It is not just about ensuring the integrity of data stored in SQL databases — it spans the whole spectrum of data storage including blob storage, document databases, email and AI frameworks. It has an extensive list of features for organising and monitoring your enterprise data. This includes.

Visual playback of the user journey: Introducing Session Replay in Grafana Cloud Frontend Observability

Grafana Cloud Frontend Observability helps engineering teams quantify the end user experience by bringing metrics, logs, traces, and user session context to client-side web applications. Teams can monitor application health and performance over time, triage errors, and correlate frontend signals with backend telemetry to investigate issues across the stack.

The finance dashboard I actually use, built from CloudZero and Campfire in an afternoon

Every finance person I know lives in the same loop approaching the end of the month, quarter, or fiscal year. Leadership wants to know where the financials will land (most times before the close has occurred). CS wants customer margins. Someone on the People team needs each department’s AI spend for an OKR review, and they need it quickly to make business decisions. Each answer sits in a different tool or a different spreadsheet, and I bounce across all of them several times a day.

What's New in Digital Experience Monitoring with Grafana Cloud

Grafana Digital Experience Monitoring (DEM) brings Frontend Observability and Synthetic Monitoring together, so teams can go from symptom to root cause without bouncing between tools. In this video, Bukola, Senior Developer Advocate at Grafana Labs, demos two of the newest DEM features. Session Replay and the integration between Synthetic Monitoring and Frontend Observability.

Grafana Pyroscope: Call Tree, Heat Map, & Adaptive Profiles (August 2026 Community Call)

We will look at some new features: Call Tree, Heat Map, & Adaptive Profiles Can't comment in the chat? You may need to create a channel. Join us live for an introduction to flame graphs. We’ll cover what they are, how to read them, and how to use them to find performance bottlenecks in your applications. Bring your questions! Grafana Cloud is the easiest way to get started with Grafana dashboards, metrics, logs, traces, and profiles. Our forever-free tier includes access to 10k metrics, 50GB logs, 50GB traces and more.

Better context, smarter testing: How to give your AI coding agent direct access to k6 docs

As testing workflows become more AI-assisted, fast access to accurate documentation matters more than ever. Whether you're writing a new load test, troubleshooting an issue, or having an AI agent generate a script for you, you need reliable guidance that keeps pace with the way you work. But most documentation still lives in a browser. Every time you or your agent needs to verify an API or look up a best practice, you're forced to leave your terminal or editor and interrupt your workflow.

How KPIs lose their meaning and what to do about it

Once you've published more than a handful of KPIs, you eventually need a way to summarize them. A total cost. An overall health status. An organization-wide SLA. Something that lets you answer the big questions without opening ten different dashboards. Summarizing those into a handful of KPIs usually feels straightforward. You add things together, average them, or collapse several statuses into one. The dashboard becomes easier to read, and nothing looks obviously wrong.

SigNoz Cloud Dashboard Schema Is Now Built for AI Agents

A quick walkthrough of SigNoz Cloud's new dashboard schema, redesigned to make dashboard operations by AI agents faster, more reliable, and lighter on tokens. AI agents are increasingly creating and editing observability dashboards. We redesigned the SigNoz Cloud dashboard data model with a structured, strictly validated schema so agents can work against defined fields and paths instead of inferring the dashboard structure.

5 Best CAFM and Facilities Management Software Providers in 2026

Managing facilities across multiple businesses, sites, assets, and contractors can quickly become a full-time administrative job. That's where Computer-Aided Facilities Management (CAFM) software comes in. It gives teams a central place to manage reactive maintenance, planned preventative maintenance (PPM), assets, contractors, compliance, and more.

How volumetric sampling makes the most of your trace budget in Grafana Cloud

Tracing is one of the richest observability signals, but it's also noisy and susceptible to data bloat. In a busy system, the vast majority of traces describe the same healthy, fast, successful request over and over, so most organizations downsample their traces to cut costs. But that approach has consequences, since the sampling strategy you choose determines whether you get a faithful picture of your whole system, or just a smaller, blurrier copy of your busiest endpoints.

Grafana Tempo: Trace diff & span pruning (August 2026 Community Call)

We will look at some new features: trace diff and span pruning Can't comment in the chat? You may need to create a channel. Join us live for an introduction to flame graphs. We’ll cover what they are, how to read them, and how to use them to find performance bottlenecks in your applications. Bring your questions! Grafana Cloud is the easiest way to get started with Grafana dashboards, metrics, logs, traces, and profiles. Our forever-free tier includes access to 10k metrics, 50GB logs, 50GB traces and more.

How to visualize workflows and business processes in Grafana: Introducing the Graphviz panel

Here's a scenario that will likely sound familiar: You’re building an executive overview dashboard that you would put on a wall-mounted screen so the whole room can see how the business is doing at a glance. It’s for a Shopify online store, and displays a mix of business and application signals, including latency panels, error-rate panels, and a big stat panel for revenue-per-week. It looked great. But something is missing.

How a Shared Case Dashboard Keeps Hundreds of Court Dates Straight

Walk into the operations floor of a large regional law firm on any given morning and the first thing you notice is not the stacks of paper you might expect. It is the wall of monitors, each one displaying a rolling feed of court dates, filing deadlines, and case statuses updated in real time. For firms handling volume caseloads, especially those built around traffic and misdemeanor defense, this kind of shared visibility has become the backbone of daily operations. The technology behind it did not arrive overnight, but its effect on how large practices manage hundreds of active matters at once has been substantial.