The latest News and Information on DevOps, CI/CD, Automation and related technologies.
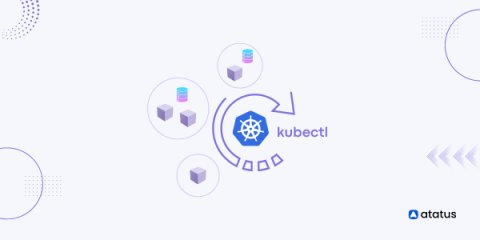
Managing containerized applications efficiently in the dynamic realm of Kubernetes is essential for smooth deployments and optimal performance. Kubernetes empowers us with powerful orchestration capabilities, enabling seamless scaling and deployment of applications. However, in real-world scenarios, there are situations that necessitate the restarting of Pods, whether to apply configuration changes, recover from failures, or address misbehaving applications.
This article will outline what Redis database monitoring is and how to set up a Redis database monitoring system with MetricFire. Then we’ll show what the final graphs and dashboards look like when displayed on Grafana. We will be using Prometheus and Grafana to power the monitoring, and we'll use a simulated Redis DB to generate the data for the Grafana dashboards.
Building, testing and deploying software is a time-consuming process that many organizations aim to minimize by automating repeatable work wherever possible. To do so, many organizations are utilizing a continuous integration, continuous delivery (CI/CD) philosophy in combination with cloud native tools like Kubernetes to develop and deploy software at scale.
Ensuring software availability is essential for any SaaS company—including Gremlin. To do that, our teams need to identify the reliability risks hiding in our systems. That’s why our development, platform, and SRE teams use Gremlin regularly to perform Chaos Engineering experiments, run reliability tests, and track the reliability of our systems against our standards. Along the way they’ve picked up a thing or two about how to find and fix reliability risks with Gremlin.