Process Automation and Rundeck OSS Release Notes v4.7.0
Product Manager Jake Cohen dons both the zipup and the hat this week to take us through the new features and plugins for the v4.7.0 release of Process Automation and Rundeck Open Source.


The latest News and Information on DevOps, CI/CD, Automation and related technologies.
Cloud automation can do a lot for your organization, making it possible to automate resource creation, management, and housekeeping tasks. If you’ve thought that cloud automation is out of reach, or you’re curious to learn what it can do, we’re excited to announce a brand new webinar that can help! Discover cloud automation in action and walk away with code that you can get up and running within an hour.
In this article, we will look at what Puppet is and why it is important to monitor Puppet server metrics. We will also analyze the tools that help us monitor Puppet’s performance. Ultimately we will learn about the benefits of using Hosted Graphite by MetricFire to monitor Puppet server metrics. Sign up for MetricFire free trial today or book a demo with the MetricFire team to understand how you can take advantage of its monitoring solutions.
For most organizations, GitHub is mission critical. Your GitHub repositories likely also contain some of your organization’s most sensitive data. GitHub provides tools to help you protect and govern this data, with tools such as audit logs, code scanning alerts, and secret scanning alerts. However, analyzing these logs and alerts through GitHub’s UI can be challenging. For example, looking for trends in your code scanning alerts over time through GitHub’s UI is just not possible.
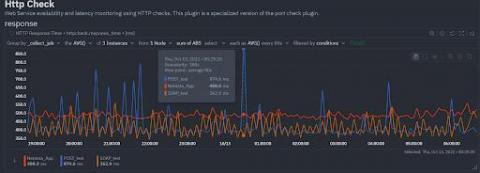
The HTTP protocol has become the de facto standard application layer protocol of the internet. From publicly available web sites and APIs to “inter-process” communications in REST based microservice architectures or large Service Oriented Architectures based on SOAP, you find HTTP being used again and again, due to its simplicity and our familiarity with it. How many protocols can you name that have memes for their status codes?