Operations | Monitoring | ITSM | DevOps | Cloud

Datadog

Control your log volumes with Datadog Observability Pipelines

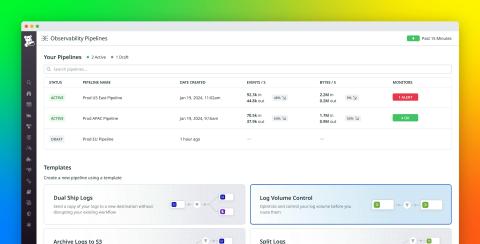
Modern organizations face a challenge in handling the massive volumes of log data—often scaling to terabytes—that they generate across their environments every day. Teams rely on this data to help them identify, diagnose, and resolve issues more quickly, but how and where should they store logs to best suit this purpose? For many organizations, the immediate answer is to consolidate all logs remotely in higher-cost indexed storage to ready them for searching and analysis.

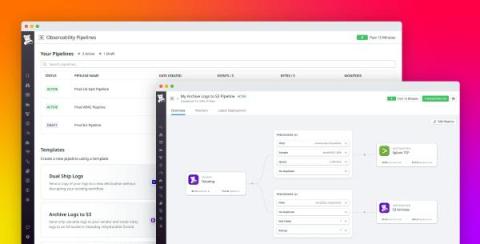
Aggregate, process, and route logs easily with Datadog Observability Pipelines

The volume of logs generated from modern environments can overwhelm teams, making it difficult to manage, process, and derive measurable value from them. As organizations seek to manage this influx of data with log management systems, SIEM providers, or storage solutions, they can inadvertently become locked into vendor ecosystems, face substantial network costs and processing fees, and run the risk of sensitive data leakage.

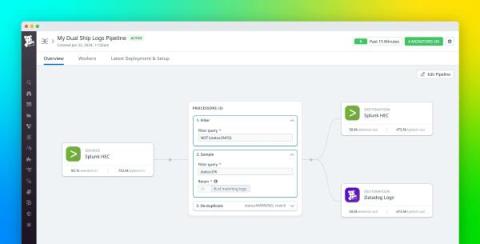
Dual ship logs with Datadog Observability Pipelines

Organizations often adjust their logging strategy to meet their changing observability needs for use cases such as security, auditing, log management, and long-term storage. This process involves trialing and eventually migrating to new solutions without disrupting existing workflows. However, configuring and maintaining multiple log pipelines can be complex. Enabling new solutions across your infrastructure and migrating everyone to a shared platform requires significant time and engineering effort.

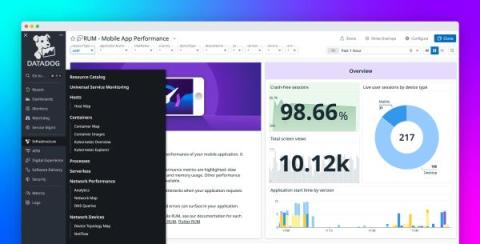
A closer look at our navigation redesign

Helping our users gain end-to-end visibility into their systems is key to the Datadog platform— to achieve this, we offer over 20 products and more than 700 integrations. However, with an ever-expanding, increasingly diverse catalog, it’s more important than ever that users have clear paths for quickly finding what they need.

Recapping Datadog Summit London 2024

In the last week of March 2024, Datadog hosted its latest Datadog Summit in London to celebrate our community. As Jeremy Garcia, Datadog’s VP of Technical Community and Open Source, mentioned during his welcome remarks, London is the first city that has seen two Datadog Summits, with the first one in 2018. It was great to be able to see how our community there has grown over the past six years.

And What About my User Experience?

Monitoring backend signals has been standard practice for years, and tech companies have been alerting their SRE and software engineers when API endpoints are failing. But when you’re alerted about a backend issue, it’s often your end users who are directly affected. Shouldn’t we observe and alert on this user experience issues early on? As frontend monitoring is a newer practice, companies often struggle to identify signals that can help them pinpoint user frustrations or performance problems.

What is an Anomaly? Avoiding False Positives in Watchdog Detected Anomalies

In 2018 Datadog released Watchdog to proactively detect anomalies on your observability data. But what defines an anomaly? How do you avoid false positives? At Datadog Summit London 2024, Nils Bunge, product manager at Datadog, shared the story of the creation of the first Datadog AI feature (Watchdog Alert), what we learned from it and how we applied those lessons to all the added AI functionalities across the years.

Stay up to date on the latest incidents with Bits AI

Since the release of ChatGPT, there’s been growing excitement about the potential of generative AI—a class of artificial intelligence trained on pre-existing datasets to generate text, images, videos, and other media—to transform global businesses. Last year, we released our own generative AI-powered DevOps copilot called Bits AI in private beta. Bits AI provides a conversational UI to explore observability data using natural language.

Monitor SQS with Data Streams Monitoring

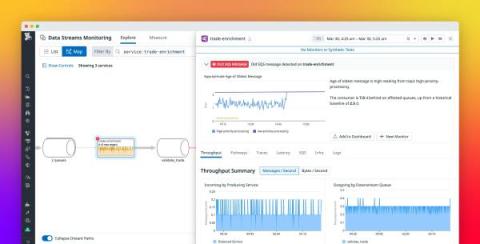
Datadog Data Streams Monitoring (DSM) provides detailed visibility into your event-driven applications and streaming data pipelines, letting you easily track and improve performance. We’ve covered DSM for Kafka and RabbitMQ users previously on our blog. In this post, we’ll guide you through using DSM to monitor applications built with Amazon Simple Queue Service (SQS).