If you're using TrueFoundry to manage your LLM traffic, you can now send those traces directly to Last9 and view them alongside your existing infrastructure telemetry.
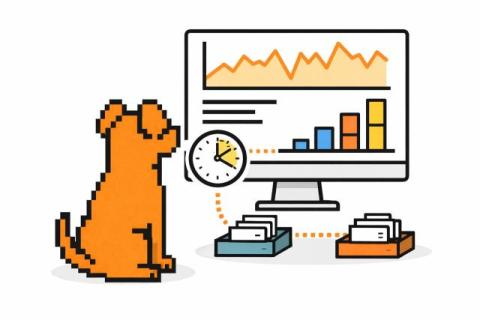
Regular monitoring practices can emphasize application response time, but queue time is also often an early and important warning sign. If it rises, you’ll quickly see downstream effects: tail latency, timeouts, and error spikes. This means that this metric can give you a head start tackling app issues before they become user problems. In this post, we’ll discuss queue time, how things can go off track, and practical steps to turn it around.
The Valkey JSON module implements native JSON data type support within Valkey, allowing users to efficiently store, query, and modify complex, nested JSON data structures directly. This overcomes previous architectural complexities, such as needing to serialize entire documents as strings or flatten data into hashes, by providing native handling for nested data models.
By Doreen Jacobi, DERDACK / SIGNL4 It is that time of the year again. Time to reflect and look back at 2025. And I find myself thinking less about platforms and features – and more about the people behind them. The engineers who pick up the phone at 2 a.m. The operators who make judgment calls with incomplete information. The responders who keep systems running when everything feels urgent. If this year taught us anything, it’s this: technology can detect the problem, but people solve it.
This post takes a closer look at how Sentry’s AI Code Review actually works. As part of Seer, Sentry’s AI debugger, it uses Sentry context to accurately predict bugs. It runs automatically or on-demand, pointing out issues and suggesting fixes before you ship. We know AI tools can be noisy, so this system focuses on finding real bugs in your actual changes—not spamming you with false positives and unhelpful style tips.
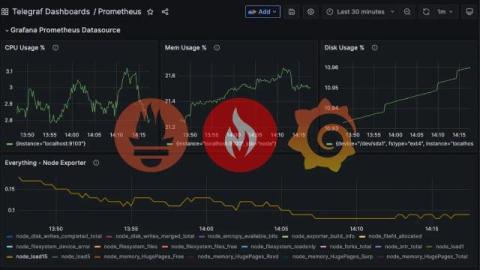
Prometheus is one of the most popular open-source monitoring systems in the world. It’s lightweight, easy to deploy, and pairs beautifully with Grafana for dashboards and alerting. If you're running applications or infrastructure on Linux, Prometheus plus one of many Exporters (Redis, NVIDIA GPU, Nginx, etc.) gives you deep visibility into service performance - quickly and reliably.
Artificial Intelligence for IT Operations ingests telemetry across logs, traces, events, resource signals, runtime behavior, and application pathways. AI for IT operations reduces alert noise, correlates events into unified narratives, predicts degradation, and drives remediation logic with pattern-based execution. Telemetry growth makes manual triage slow, while inference scales linearly with data.
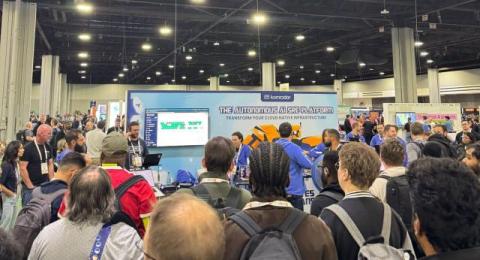
KubeCon + CloudNativeCon North America 2025 in Atlanta marked a definitive moment for cloud-native infrastructure. Over four days, celebrating the 10th anniversary of both CNCF and Kubernetes, more than 9,000 attendees witnessed the ecosystem’s evolution from container orchestration to AI-native operations. The conference delivered a clear message – AI workloads are no longer experimental.
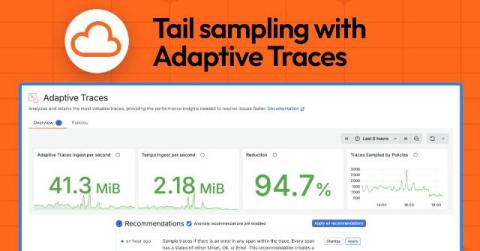
Tracing is the richest observability signal in common use today. In distributed systems, it reveals how requests flow across multiple services, allowing you to uncover and address performance bottlenecks. Teams often scale back or abandon tracing altogether, however, because most successful requests produce redundant data that’s noisy and expensive to store.
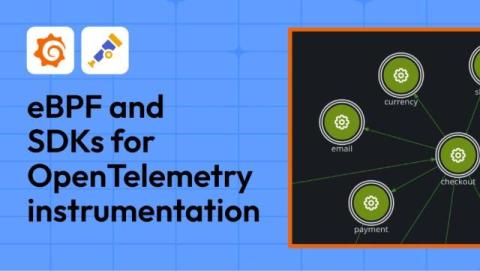
As a vendor-neutral open standard, OpenTelemetry has become the default choice for application instrumentation. However, it’s important to remember that OpenTelemetry isn’t a single technology — it’s an ecosystem. Under the hood, it provides multiple options for instrumenting your applications. In this blog post, we explore two instrumentation approaches: OpenTelemetry eBPF Instrumentation and runtime-specific OpenTelemetry SDKs, like the OpenTelemetry Java agent.