Operations | Monitoring | ITSM | DevOps | Cloud

The latest News and Information on Log Management, Log Analytics and related technologies.

Logging Best Practices Part 3: Text-based logs and structured logs

Isn’t all logging pretty much the same? Logs appear by default, like magic, without any further intervention by teams other than simply starting a system… right? While logging may seem like simple magic, there’s a lot to consider. Logs don’t just automatically appear for all levels of your architecture, and any logs that do automatically appear probably don’t have all of the details that you need to successfully understand what a system is doing.

Announcing new Sumo Logic dashboards

We’re excited to announce the first version release of our new dashboard framework: Dashboard (New). Built on top of a scalable, flexible, and extensible charting system, the new dashboards provide customers with deep control over their visuals, enable metadata rich workflows, and create dashboards in a dashboard first GUI.

Part One: How to Build Monitoring Dashboards based on Grafana with Logz.io

Logz.io customers use our Infrastructure Monitoring product to collect, store, and analyze metrics. In this webinar, Daniel and Noa will explain some of the basics of getting started with the product and cover some recent product additions with Grafana 7.

Heroku Continuous Integration & Deployment with Docker [Hands-On Tutorial]

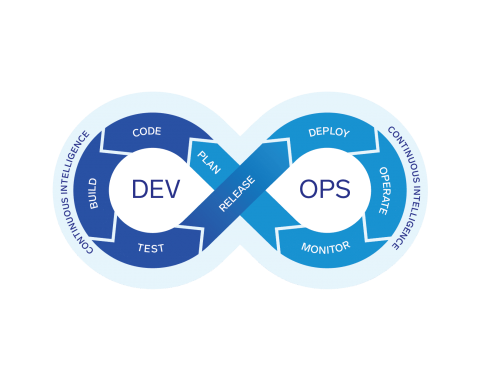
In this tutorial, we will be using Heroku to deploy our Node.js application through CircleCI using Docker. We will set up Heroku Continuous Integration and Deployment (CI/CD) pipelines using Git as a single source of truth. Containerization allows developers to create and deploy applications faster with a wide range of other benefits like increased security, efficiency, agility to integrate with DevOps pipelines, portability, and scalability.

Containers, Microservices, and Kubernetes

Faster application development requires more agile application infrastructure. Containers started the transformation of modern application architectures which now are dominated by microservices running on Kubernetes. In this episode of Dissecting DevOps find out how cloud infrastructure has changed, how the modern architectures make application development easier, and the unique challenges introduced by microservices and Kubernetes.

How Do I View My Elasticsearch Mappings?

There are two ways you can view the current mappings on your Logit ELK Stacks. One way is to use dev tools in Kibana. You can access Kibana from any of your dashboards by choosing from your dashboard Stack settings > Access Kibana. You can also search for a specific mapping of an Index name. For example if we wanted to see the mappings for the a Filebeat index name we can run the following to return only the desired mappings.

Loki tutorial: How to send logs from EKS with Promtail to get full visibility in Grafana

Amazon Elastic Kubernetes Service (Amazon EKS) is the fully managed Kubernetes service on AWS. If you’re using it and wondering how to query all your logs in one place, Loki is the answer. With this tutorial, you’ll learn how to set up Promtail on EKS to get full visibility into your cluster logs while using Grafana. We’ll start by forwarding pods logs then nodes services and finally Kubernetes events.

LM Logs: A Mission to Decrease MTTR by Bringing Metrics and Logs Together

Imagine it’s 3 AM, you’ve just been paged for a critical issue- queues filling up quickly, and you don’t know why. You turn to logs, looking for something abnormal, a change that could explain what is happening so you can fix it. Sound familiar? Unfortunately, searching through logs to uncover changes is a time-consuming process.