Operations | Monitoring | ITSM | DevOps | Cloud

Monitoring vs Observability: Can You Tell The Difference?

Monitoring vs observability – is there even a difference and is your monitoring system observable? Observability has gained a lot of popularity in recent years. Modern DevOps paradigms encourage building robust applications by incorporating automation, Infrastructure as Code, and agile development. To assess the health and “robustness” of IT systems, engineering teams typically use logs, metrics, and traces, which are used by various developer tools to facilitate observability.
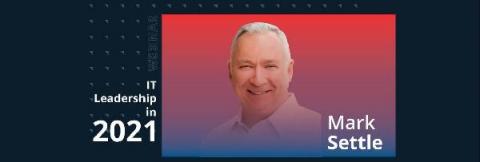

Mark Settle on IT Leadership In 2021

The year 2020 was uniquely challenging for business and IT leaders around the world. The sudden shift en masse to remote work put tremendous pressure on IT teams to pivot and keep the show running for business continuity. Going digital is no longer a debate and digital transformation became more than a project in the distant future. So what else has changed in the IT leader’s playbook? We spoke with veteran CIO and author Mark Settle.

Unit Testing: What You Need To Know

In our latest guide covering the essentials and best practices for software development we are detailing some of the necessary basics that you need to know about unit testing before you get started. To explain examples, best practices and some of the top queries around unit testing we’ve invited contributors Nelson Ford, Founder and Principal Solutions Architect at Pilotcore Systems & Ryo Chikazawa, CEO of Autify to share their thoughts below.

Building Autocomplete with ANTLR and CodeMirror

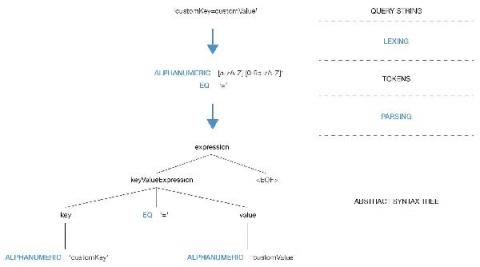
At Sumo Logic, we’re dealing with a large amount of data. To help our customers explore the data quickly and effectively, our product lets them write Logs, Metrics, and Tracing queries. One of the challenges we dealt with recently was improving the query building experience in our new, revamped Metrics UI.

Canonical & Kubernetes: 2020 highlights

Contact our Kubernetes team We’re now well into 2021, and as we plan ahead for our roadmap and activities around Kubernetes for the year, it helps to look back and reflect on everything that took place for Canonical in the K8s space within the year that passed. Kubernetes has always been a crucial part of Canonical’s vision and contribution to the IT world.

Building a Telegraf Assistant - UC Berkeley Codebase

This article was written by Codebase, a UC Berkeley student organization. Hello InfluxData community! We are a team from Codebase, a UC Berkeley student organization that builds software projects for high-growth tech companies. This past semester, the eight of us had the incredible opportunity to work with InfluxData to add cloud-controlled configuration management features to Telegraf.

Centralized Log Management and Cloud Environments

Even before new hybrid workforce models, many companies already moved a lot of services to the cloud. COVID-19 digital transformation strategies instantly increased the number of access points and endpoints. This led to a rapid increase in event log data followed by all kinds of other issues -- performance, availability, security, and ultimately increased IT costs amongst other things. A centralized log management solution for your cloud environment can help you manage the above and more.

Datadog achieves FedRAMP Moderate Impact authorization

As government agencies accelerate migrating their operations to the cloud, they need to adhere to strict compliance and security standards. The Federal Risk and Authorization Management Program (FedRAMP) provides the standard that these agencies—and their private-sector partners—must meet to work and manage federal data safely in the cloud.

Monitoring Tools for MSP: Things to Consider

Monitoring is a major part of a Managed Service Provider or MSP. After all, it emerged as remote management and monitoring (RMM) of servers. However, today MSP’s scope is well-defined and distinguished from standard RMMs. Nevertheless, monitoring is still a key service that these companies provide to their clients. Managed service providers take care of all the IT infrastructure of their clients.

How to monitor your AWS servers via MetricFire

In this article we explore the basics of monitoring Amazon Web Services (AWS) by feeding metrics to Grafana through Hosted Graphite’s agent and also through Hosted Graphite’s AWS add-on. This will allow us to monitor metrics from applications and servers hosted in AWS with clarity and depth. This article assumes you have created a Hosted Graphite account.