Operations | Monitoring | ITSM | DevOps | Cloud

The latest News and Information on Monitoring for Websites, Applications, APIs, Infrastructure, and other technologies.

ActiveMQ Log Analysis & Diagnostics: The Expert Guide

Senior engineers who are fast at diagnosing ActiveMQ incidents share one trait: they know exactly what they are looking for in the broker log before they open it. They know the PFC signature, the OOM warning pattern, the journal recovery sequence, and the connection drop format. For them, the log is not text to search through, it is a structured operational record that maps each entry to a specific broker state.
ActiveMQ Capacity Planning: The Complete Framework

Most ActiveMQ deployments are sized in one of two ways: either under-provisioned from underestimating growth ("we'll upgrade when we need to") or over-provisioned from anxiety ("better give it 32GB just in case"). Both approaches are avoidable with a structured capacity planning framework that translates your messaging workload characteristics into specific hardware and configuration requirements.

Upgraded Alert AI Analysis: Automated Incident Investigation

TL;DR: OrionIQ has launched the next generation of its Alert AI Analysis agent within the Open 360 AI platform, designed to automate and accelerate incident investigation. Key features of this evolution include: Agent-Based Investigation: Instead of relying on a single prompt, the system coordinates specialized AI agents to correlate data across diverse sources like logs, metrics, deployments, and tickets.

Part II: Inside Alert AI Analysis: From a Single-Agent Prompt to an Agent Harness

TL;DR: This is the engineering companion to our announcement post, Upgraded Alert AI Analysis: Automated Incident Investigation, read that one for what the new generation does for your team; read on for how it works under the hood. Interested in hearing more? Book a demo to see the Alert AI Analysis Agent live. Root cause analysis is one of the harshest tests you can give an AI.

What Is Synthetic Monitoring and Why Does It Matter?

A website can look healthy on your dashboard and still fail when customers try to use it. So how do you catch problems before anyone notices them? In this video, you'll learn what synthetic monitoring is, how it works, and why IT teams use it to detect website and application issues before they impact real users. Discover how automated user journeys help you monitor availability, performance, and critical business transactions 24/7.

VictoriaMetrics 2026 Mid Year Roundup

In the first half of 2026, we shipped a wide range of improvements across metrics, logs, traces, cloud, and the Kubernetes operator. Our main focus across open-source components and enterprise solutions was on performance, stability, and making observability easier to adopt and operate day‑to‑day. This roundup brings together the most important changes to date, including a quick look back at key anomaly detection improvements from 2025 that are now paying off today.

Sentry Seer, MCP, & Warp Agents: Fixing Sentry Issues Outside of Sentry

This video walks through connecting Sentry's MCP server to a Warp Agent, so instead of an agent starting from a raw error, it starts from Seer's actual root cause diagnosis: the error, the surrounding code, and recent commits. From there, the Warp Agent takes that diagnosis, implements the fix directly in the codebase, and opens a PR, all without leaving Warp.

Real User Monitoring: Introducing Session Replay for eG Enterprise

In the hospitality industry, every second counts—especially when it comes to online bookings. Recently, I’ve been working with a hospitality customer who relies on eG Innovations SaaS to monitor the performance of their booking website. Like many modern sites, theirs is powered by numerous plugins and external third‑party services, each playing a crucial role in delivering a smooth booking experience while also introducing potential points of delay.

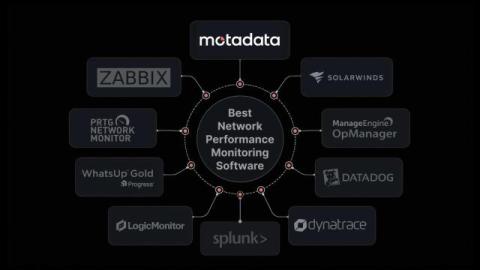
10 Best Network Performance Monitoring Software for 2026

Almost every network monitoring tool on the market promises the same few things, which is full visibility, faster root cause, and fewer pointless alerts. Spend enough time looking into them and the websites all start to sound the same, and most of them read better on the page than they hold up on the day the network actually slows down.