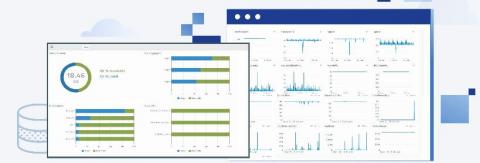
"Hot-take" on 3 Popular Open Source Tools & The Observability Landscape
New eGuide takes a closer look at Prometheus, ELK and Jaeger:


The latest News and Information on Monitoring for Websites, Applications, APIs, Infrastructure, and other technologies.
New eGuide takes a closer look at Prometheus, ELK and Jaeger:
OpsRamp helps IT teams monitor the availability of physical, logical, and virtual storage resources with performance indicators for storage capacity, overall utilization, and disk latency. IT teams can optimize their storage environments with granular visibility for storage components such as volume, fiber channel, RAID, SAN switches, LUNs, caches, and disks.
It’s Friday afternoon, the majority of the development staff has already packed up and headed home for the weekend, but you remain to see the latest hotfix through to production. To your dismay, immediately after deployment, queues start backing up and you begin to get alerts from your monitoring system. Something has been broken and all evidence points to an application performance bottleneck.
When the web was first constructed, it became clear the servers that sent web pages, images and other digital assets to browsers would need some kind of standardized system of error notification. Since there were several errors that always reported the same basic fault, it was decided this would be a good way to diagnose network problems without specialized tools or elaborate communications protocols.
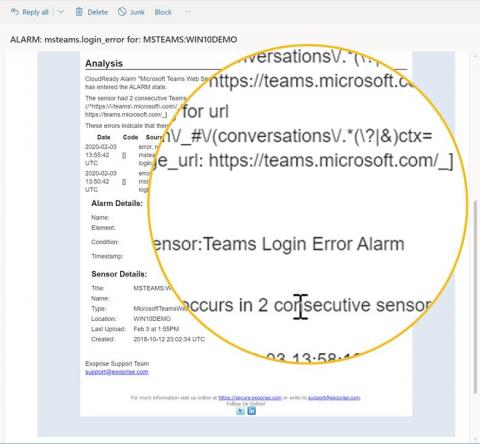
Microsoft Teams had an outage yesterday, on February 3rd 2020, for a few hours, and apparently it was due to an expired TLS / SSL certificate. The Internet erupted in delight over this for some reason with lots of coverage everywhere. Slack and MS Teams usually do garner more attention when they experience unfortunate outages most likely due to their rivalry. Apparently, because this was an expired certificate it gave everyone a reason to write “Oops” and other similar quips.
When starting development on a new front end project, I always ask myself "Which JavaScript unit testing frameworks should I use?" My colleagues often write about how unit tests are great for peace of mind and reducing software errors. So I always make the time to test. But which framework should you choose for your project? Before rushing into any decisions, I investigated seven of the most popular JavaScript unit testing frameworks so you can decide which one is best for you.
Digital Experience Monitoring (DEM) is a growing practice within IT organizations that provides insight into the factors that make up the overall application User Experience (UX). As systems become more complex, as cloud adoption continues to grow, and IT loses direct control of infrastructure, it becomes both more difficult and more important to capture the overall end-user experience.
Since AWS Lambda was launched in 2014, serverless has transformed the way applications are built, deployed, and managed. By abstracting away the underlying infrastructure, developers are able to shift operational responsibilities to the cloud provider and focus on solving customer problems.
PromQL is the querying language that is part of Prometheus. In addition to PromQL, Prometheus provides a scraper that fetches metrics from instances (any application providing metrics) and a time series database (TSDB), which stores these metrics over time. This introduction to PromQL will be largely decoupled from specific tools and the non-PromQL parts of Prometheus, in order to focus on the features of the language itself.
Today, we will dive into one of the hard parts of using any monitoring - making sense out of all the data that is emitted. We think this is one of the hard parts. And being developers building for developers, we think a lot like you do – we think. Pun intended. Nowadays, we monitor AppSignal with AppSignal (on a separate setup), so we are still dogfooding all the time. We still run into challenges as you do, often before you.