Operations | Monitoring | ITSM | DevOps | Cloud

How can you simplify web performance monitoring with auto RUM injection

Real user monitoring (RUM) is a powerful tool for optimizing the end-user experiences of web applications. With insights into performance, load times, user behavior, and more, RUM enables businesses to identify and address issues that negatively impact user satisfaction. Consider a scenario where a growing e-commerce company experiences periodic slowdowns during peak hours, adversely affecting user experiences and sales.

Redefining RUM: A Comparative Gap Analysis of Existing Tools

Real user monitoring (RUM) began as a straightforward approach to tracking basic web performance metrics. Focused on things like page load times and response rates, RUM relied on server-side logging and simple browser timings. While these tools captured Core Web Vitals (CWVs), they offered limited insights into how users actually interacted with pages, focused mainly on server-side performance.

How to Set Up Real User Monitoring in SolarWinds Observability Platform

Learn how to set up Real User Monitoring in the SolarWinds Observability Platform to track and analyze the real-time performance of your website. This tutorial covers integrating Real User Monitoring with your website, setting performance thresholds, and configuring the tool for single-page applications. By the end, you'll know how to gain valuable insights into your end users' experience and optimize your website's performance.

RUM vs. Synthetic Monitoring: DevOps Team's Essential Guide

Application slowdowns or outages interrupt the user experience and web performance. This significantly impacts brand reputation, leading to customer churn and a heavy dent in the competitive edge. This is where Application Performance Monitoring (APM) comes in. APM tracks application performance to ensure a positive user experience. Real User Monitoring (RUM) and Synthetic Monitoring are two approaches to analyzing your app’s performance and the digital experience they provide.

Gain actionable insights with real user monitoring: the latest features in Grafana Cloud Frontend Observability

One of the biggest challenges observability teams face today is gaining end-to-end visibility into their cloud native apps, including modern browser frontends. Without that visibility, you potentially open the door to bad end-user experiences that can hurt customer satisfaction, reduce search engine discoverability, and interfere with overall business goals. This is the exact challenge we address with Grafana Cloud Frontend Observability.

Introducing Mobile Real User Monitoring (RUM)

Human attention spans are seemingly shorter than ever, and your mobile application users are, unfortunately, no exception. Over 70% of users abandon an app if it’s taking too long, with half of these users waiting no more than three seconds. Even minor delays or errors can lead to significant user drop-off, negatively impacting your app’s success and user satisfaction.

Teams V2 Synthetics and Real-User Monitoring Support

With the release of Microsoft Teams 2.0 and the Classic Teams client nearing its EOL (end of life), we were eager to explore the changes that Teams 2.0 brought about. Today we will look into the new features and architecture of Teams 2.0 as well as provide insight into the changes and improvements to the CloudReady Teams Messaging and Teams AV sensors.

API update: Sessions, pages and Customers

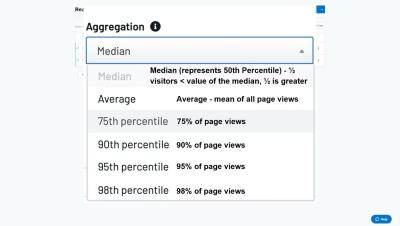
Today, we’re excited to roll out 6 new endpoints for the Raygun API, making it simpler than ever to query Sessions, Pages, and Customers. Raygun’s Real User Monitoring helps you track and enhance your front-end and mobile page speed performance. It analyzes user sessions and page views to calculate your overall page speed. Previously, this required someone to log into Raygun, find the right application, and manually inspect sessions and page views in Real User Monitoring.