Operations | Monitoring | ITSM | DevOps | Cloud

APM

The latest News and Information on Application Performance Monitoring and related technologies.

Kubectl Top Pod/Node | How to get & read resource utilization metrics of K8s?

Kubectl Top command can be used to retrieve snapshots of resource utilization of pods or nodes in your Kubernetes cluster. Resource utilization is an important thing to monitor for Kubernetes cluster owners. In order to monitor resource utilization, you can keep track of things like CPU, memory, and storage. In this article, we will see how to use kubectl Top command to get and read metrics about pods and nodes. We will also breakdown the output to understand what it means.

Kubectl Logs Tail | How to Tail Kubernetes Logs

The kubectl logs tail command is a tool that allows users to stream the logs of a pod in real-time while using Kubernetes. This command is particularly useful for debugging and monitoring applications, as it enables users to view log output as it is generated and quickly identify any issues or problems with their application. In this article, we will see how to use the kubectl logs tail command to stream logs, the benefits of using the command, and an advanced tool for streaming logs.

MAUI provider upgrades v2: Real User Monitoring + Crash Reporting

I’ve written previously about the process of adding Real User Monitoring capabilities to our MAUI provider. I’m excited to say that this work is now live, batteries and all, plus some more improvements since the last blog. To recap the state of cross-platform development in the.NET ecosystem, Xamarin is out of support as of May 1st! This is replaced by.NET MAUI (Multi-platform App UI), meaning developers need appropriate tools when they make the switch.

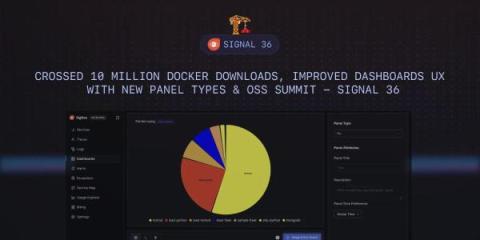
Crossed 10 Million Docker Downloads, Improved Dashboards UX with New Panel Types & OSS Summit - SigNal 36

Welcome to SigNal 36, the 36th edition of our monthly product newsletter! We crossed 10 Million Docker downloads for our open source project. We’ve enhanced our Dashboards UX and incorporated feedback from users in different areas of our product. Let’s see what humans of SigNoz were up to in the month of April 2024.
Sponsored Post

JS Toolbox 2024: Frameworks and static site generators

In 2024, JavaScript is bigger than ever. The ecosystem is just as huge, and almost impossible to keep track of - so I've had a go at picking out 2024's most essential JS tools for you. In part 1 of this series, we reviewed runtimes and package managers, the foundational building blocks of your software project. So in part 2, we're analyzing the tools which form the walls and roof that give your software project its structure: frameworks and static site generators. For this installment of JS Toolbox 2024, we explore various frameworks & generators available in the JavaScript & TypeScript ecosystem, analyzing their strengths, weaknesses, and ideal use cases.

This Month in Datadog: Bits AI for Incident Management, KSPM, New Observability Pipelines, and more

Datadog is constantly elevating the approach to cloud monitoring and security. This Month in Datadog updates you on our newest product features, announcements, resources, and events. To learn more about Datadog and start a free 14-day trial, visit Cloud Monitoring as a Service | Datadog. This month, we put the Spotlight on Bits AI for Incident Management.

Cisco announces standalone Secure Application, offering increased flexibility to security teams

Cisco's Secure Application is now available as an independent application on the Cisco Observability Platform and can be deployed with or without Cisco Cloud Observability. This announcement increases the flexibility offered to IT professionals and allows in house security teams to harness powerful security capabilities without committing to cloud native application performance monitoring.

Announcing AI Error Resolution

After months of anticipation (and invaluable input from our beta testers!) we’re so excited to officially share AI Error Resolution. We can say firsthand that this tool helps developers resolve issues with renewed speed and accuracy, using AI-powered suggestions on the root cause of errors and how to fix them. Testing has shown how effectively this feature can pinpoint the source of an error and produce the most efficient method to resolve it, accelerating the entire debugging process.