The much-anticipated release of Grafana Tempo 2.0, which we previewed at ObservabilityCON 2022, will represent a huge step forward for the distributed tracing backend. Among the biggest highlights will be TraceQL, a first-of-its-kind query language that makes it easier than ever to find the exact trace you’re looking for. There’s supposed to be a video here, but for some reason there isn’t. Either we entered the id wrong (oops!), or Vimeo is down.
As a developer, it can become challenging to manage Kubernetes and develop applications simultaneously. That’s why we put together this guide to show you how the Kubernetes Dashboard can help developers overcome this problem and get an overview of the cluster and its workloads. From this, developers can focus more on application development while stressing less on cluster management.
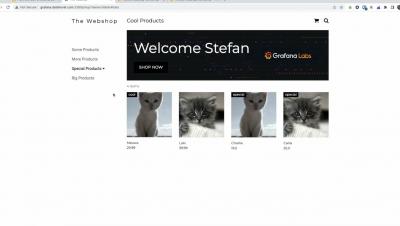
Welcome to Grafana 9.3! Get Grafana 9.3 In our continued efforts to make Grafana more accessible and easier to use, we are excited to showcase new updates to improve navigation, introduce localization, and much more. Read our What’s New documentation to learn all about the latest release and for more details, refer to the changelog.
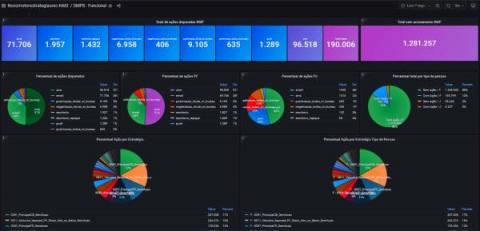
Brazil’s Banco Itaú is the largest bank in Latin America, so when performance and uptime issues impact its applications, the reverberations can be massive. “It can impact the whole economy of Brazil. It can damage other banks’ business too,” Ana Paula Genari Martin, SRE manager at Banco Itaú, said in her recent ObservabilityCON talk. And keeping those applications running is no small feat, considering the size of their digital operations.
It’s hard to think of a use case that Grafana hasn’t been used for. When Torkel Ödegaard launched the Grafana open source project with his first commit in December 2013, “my goal was to make time series data accessible for a wider audience, to make it easier to build dashboards, and to make graphs and dashboards more interactive,” he said.
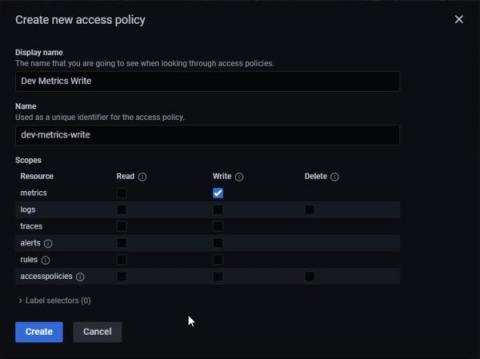
Until recently, Grafana Cloud users had to rely on API keys to read and write data to and from the composable observability platform. These API keys had minimal features, which limited administrators’ ability to manage account access on a granular level. We’re keenly aware of these shortcomings, and we’ve been working to overhaul and replace these API keys with something more flexible, more reliable, and more secure.
Did you know that the visual console editor allows users to design the final look by dragging elements with the mouse? You just have to choose the background and icons that represent the status of each relevant aspect you want to display. We tell you this and much more in the video on our workshop.
California-based Medallia captures feedback signals — in-person interactions, customer surveys, call centers, social media, etc. — to help businesses improve their customer experience. In much the same way, the company’s Performance and Observability Engineering team captures observability signals to optimize the experience for internal users.
Over the course of two decades, Adform grew from a dream between friends huddled in a basement to a leading advertising tech platform powering more than 25,000 clients worldwide. Success brought external accolades, but it also created the need for internal innovation to support the company’s continued growth. In 2018, Adform was still operating in startup mode, which meant developers and teams cherry-picked the tools that worked best for them.
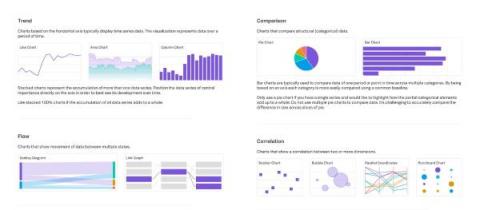
There are many visualization types and configurations available to choose from. In general, keep your visualizations as simple and straightforward as possible to avoid distraction and highlight only the most important information. If there is too much unnecessary information on the page it can be overwhelming and focus can be misdirected to unimportant details.
The shift toward building modern applications as a collection of API-driven services has many benefits, but let’s be honest, simplified monitoring and troubleshooting is not one of them.
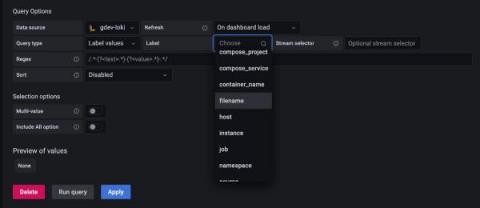
As part of the Grafana 9.2 release, we’re making it easier to create dynamic and interactive dashboards with a new and improved Grafana Loki query variable editor. Templating is a great option if you don’t want to deal with hard-coding certain elements in your queries, like the names of specific servers or applications. Previously, you had to remember and enter specific syntax in order to run queries on label names or values.
When it comes to visualization tools, there are various options, all designed for different kinds of data. Some of the most recognized among them include Grafana and Tableau. If you’re not sure which one to use, this article should give you a better idea of what kind of purpose each one has and which one will suit your needs best. One great way to find out what tool works best for you is to try it out! Try out Grafana in seconds on MetricFire's Hosted Grafana free trial.
Here at Grafana Labs, we’re deeply committed to our “big tent” philosophy — the idea that disparate data sources, from different software providers, in different industries, built for completely different use cases, can come together in one composable observability platform. As part of that commitment, we’ve set out to hear from our community about their observability practice and what they hope to see in this space in the future.
Today the Grafana Agent team is excited to announce the release of Grafana Agent v0.29.0. This September, we introduced a new way to easily run and configure Grafana Agent called Grafana Agent Flow, our new dynamic configuration runtime built on components. Within Flow, we are also embracing Grafana Labs’ big tent philosophy by introducing OpenTelemetry (OTel) Collector components and converters for traces, metrics, and logs in Agent v0.29.0.
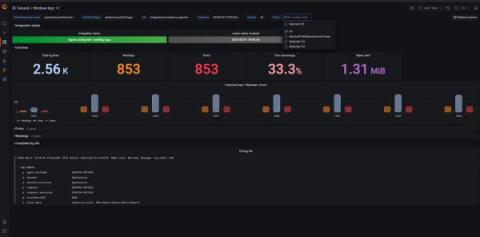
As we all know, Windows is one of the most popular operating systems in the world. It has a dominant share in the desktop computer market, with more than 70% of the machines running the operating system. It makes sense, then, that the Windows integration is also one of the most used and popular integrations in Grafana Cloud.
At Grafana Labs, we understand that clear, informative technical documentation is critical to users’ success, whether they’re just getting started or trying to quickly troubleshoot an issue. That’s why the Documentation and Technical Writing Team at Grafana Labs is pleased to announce the launch of our very first, very own writers’ toolkit.
Google Kubernetes Engine (GKE) is a managed Kubernetes service that enables users to deploy and orchestrate containerized applications on Google’s infrastructure. Datadog’s GKE integration, when paired with our Kubernetes integration, has always provided deep visibility into the health and performance of your clusters at the node, pod, container, and application levels.
At ObservabilityCON in New York City today, we announced a new open source backend for continuous profiling data: Grafana Phlare. We are excited to share this horizontally scalable, highly available database with the open source community — along with a new flame graph panel for visualizing profiling data in Grafana — to help you use continuous profiling to understand your application performance and optimize your infrastructure spend.
ObservabilityCON 2022 is taking place today with a host of exciting announcements, from new OSS projects, partnerships, and integrations to the latest easy-to-use features in the Grafana LGTM stack. “As an OSS company, we prioritize interoperability. The big tent is at the heart of everything we do, and Grafana is at the heart of the wider ecosystem,” says Grafana Labs Co-founder and CEO Raj Dutt.
Today, during the ObservabilityCon 2022 keynote session, we announced a new open source project for frontend application observability, Grafana Faro. The project is launching with a highly configurable web SDK that instruments web applications to capture observability signals. This frontend telemetry can then be correlated with backend and infrastructure data for seamless, full-stack observability. There’s supposed to be a video here, but for some reason there isn’t.
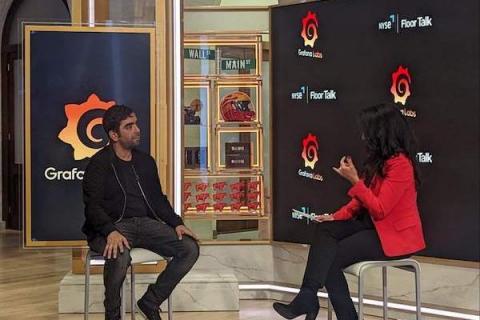
Grafana Labs CEO and Co-founder Raj Dutt sat down with “NYSE Floor Talk” ahead of ObservabilityCON to discuss why companies are increasingly focused on observability as a means to improve customer satisfaction. In his conversation with Judy Khan Shaw, host of “NYSE Floor Talk,” Dutt also talked about Grafana Labs’ big tent philosophy and the growth of Grafana Labs and the Grafana open source community.