Operations | Monitoring | ITSM | DevOps | Cloud

The latest News and Information on Observabilty for complex systems and related technologies.

Cribl Search Demo: Security Investigation

In this demo, Nate Zemanek , Staff Solutions Engineer, shows how Cribl Search runs fast investigations. As an open data platform, Cribl Search lets you pull data from multiple sources and query everything from a single pane of glass. You’ll see how to run fast queries with the new lakehouse engine, search historical data with a federated approach, and bring everything together for full context. Then, use Notebooks to collaborate and share findings across teams to understand what happened—faster.

From Observability to Action: How Product Analytics Is Closing the Loop in Modern Operations

Over the past decade, observability has become a cornerstone of modern operations. Metrics, logs, and traces have given teams unprecedented visibility into how systems behave under real-world conditions. Infrastructure can be monitored in real time, incidents can be detected faster, and performance bottlenecks can be diagnosed with increasing precision. But for all its progress, observability still leaves an important question unanswered.

Leveraging Cognitive Diversity to Tackle System Complexity

Most engineering leaders today understand that diversity matters. They've built teams that reflect a range of backgrounds, functions, and experience levels. They run postmortems, retrospectives, and architecture reviews that bring multiple voices to the table. They believe, not unreasonably, that this variety of perspectives leads to better decisions. But there's a problem hiding inside that assumption that can undermine everything: who people are is a surprisingly poor predictor of how they think.

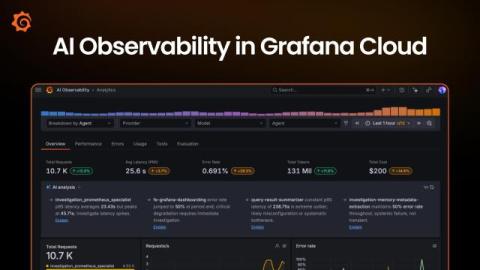
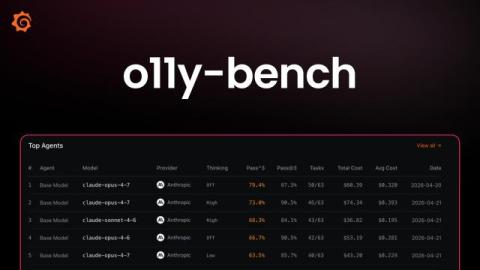
How OpenRouter and Grafana Cloud bring observability to LLM-powered applications

Chris Watts is Head of Enterprise Engineering at OpenRouter, building infrastructure for AI applications. Previously at Amazon and a startup founder. As large language models become core infrastructure for more and more applications, teams are discovering a familiar challenge in a new context: you can't improve what you can't see.

Making encrypted Java traffic observable with eBPF

Coroot's node agent uses eBPF to capture network traffic at the kernel level. It hooks into syscalls like read and write, reads the first bytes of each payload, and detects the protocol: HTTP, MySQL, PostgreSQL, Redis, Kafka, and others. This works for any language and any framework without touching application code. For encrypted traffic, we attach eBPF uprobes to TLS library functions like SSL_write and SSL_read in OpenSSL, crypto/tls in Go, and rustls in Rust.

What is Virtana Application Observability and how is it different?

Application Observability, Built for Hybrid Reality Modern applications don’t live in one place. A single transaction might span: Traditional APM shows you the trace. But hybrid reality doesn’t stop at the service layer. True application observability ties transactions to the infrastructure that actually delivered them across cloud, on-prem, and everything in between. Because in hybrid environments, the root cause rarely lives in just one tier.

Datadog Data Observability, enables you to detect data quality and pipeline issues early.

See our latest Episode of This Month in Datadog, for a spotlight of Datadog Data Observability, which enables you to detect data quality and pipeline issues early, as well as remediate those issues with end-to-end lineage. We also cover: This Month in Datadog brings you the latest updates on our newest product features, announcements, resources, and events.

Claude Code + Lightrun MCP: Your AI Agent Now Has Live Runtime Vision

Claude Code, Anthropic’s coding agent, now integrates with Lightrun through MCP. AI code assistants have been flying blind. Google Dora’ 2025 report found it is causing, an almost 10% increase in code instability. Even with up to 1M tokens of context available in Claude, this powerful agenti cannot see how the code it writes actually behaves inside a live system under real traffic, real dependencies, and under a load of 10,000 requests per second.

How agentic ITOps overcomes observability tool gaps

As enterprise ITOps teams monitor increasingly complex, cloud-based, containerized systems, traditional observability practices are struggling to keep up. As IT infrastructure complexity increases, the typical response is to layer on more monitoring, logging, and instrumentation.