Operations | Monitoring | ITSM | DevOps | Cloud

The latest News and Information on Monitoring for Websites, Applications, APIs, Infrastructure, and other technologies.

Using Device Telemetry to Answer Questions About Your Network Health

When coupled with a network observability platform, device telemetry provides network engineers and operators critical insight into cost, performance, reliability, and security. Learn how to create actionable results with device telemetry in our new article. For cloud network specialists, the landscape for their observability efforts includes a mix of physical and virtual networking devices.


Logic App Best Practices, Tips, and Tricks: #25 How to send a well-formatted custom HTML Email

Today I will speak about another important Best practice, Tips, and Tricks that you must consider while designing your business processes (Logic Apps): How to send a well-formatted custom HTML Email.

Become a Hero: How to set up Fortigate SD-WAN Network Monitor and Save the Day!

Are you tired of dealing with slow network performance, dropped connections, and frustrated users? If so, you're not alone. These issues can be a major headache for IT professionals, but there are solutions for Fortigate SD-WAN Network Monitor. In this blog post, we'll show you how to become a hero by implementing Fortigate SD-WAN Network Monitor solutions and saving the day.

Why InfluxDB Cloud, Powered by IOx is a Big Deal to Me

From time to time throughout my career, I have been involved in projects with dramatic releases when we built and delivered something very new and very special. The release of InfluxDB Cloud, powered by IOx (referred to as “InfluxDB IOx” for short below) absolutely meets those criteria. I want to explain my personal views of why this release is so impactful and why I am so excited to be part of it.

Data Modeling: Part 2 - Method for Time Series Databases

Time-varying entities may contain multiple time-varying and static attributes, making mapping them a particular challenge. Time is notorious in modeling tasks. Indeed, the temporal aspect exacerbates the complexity of the modeling task, making simple diagrams look pretty complex. The temporal dimension becomes particularly nasty when it takes part in identifying entities. The figure on the right visualizes the typical database example.

Why Grouping Devices Is So Critical for IT Infrastructure Management

135,000 is the average number of endpoint devices connected to an enterprise network. The estimate is in a joint report from Adaptiva and the Ponemon Institute, along with several other surprising statistics: A common challenge facing IT professionals is gaining insight into the devices connected to their network. With so many devices being used by employees, managers and IT workers, a solution to categorize and analyze these devices in one spot is essential.

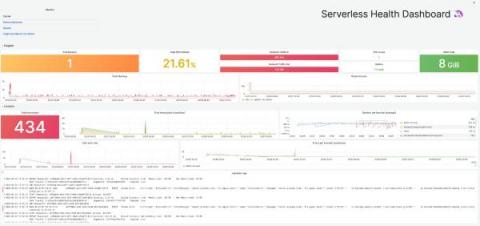
AWS Fargate monitoring: How to collect serverless logs, metrics, and traces in Grafana

Interoperability — it’s one of the main reasons I joined Grafana Labs. Our “big tent” philosophy helps Grafana work with a wide range of data sources and tools, and it’s why you can use Grafana to address endless use cases and problems. We are best known for the seamless way we correlate metrics, logs, and traces to understand what is happening in the environment, resolve the immediate issue, and address any underlying issues so that it does not happen again.