Operations | Monitoring | ITSM | DevOps | Cloud

The latest News and Information on Monitoring for Websites, Applications, APIs, Infrastructure, and other technologies.

Why External Synthetic Monitoring is Required to Complete the APM Stack

With the digital landscape shifting everything on the web, and companies fighting for better user experiences, your sites and applications are no longer just a part of your business, it is the business. But how do you to go about it and remain successful? This is where monitoring and performance management comes into the picture. Not only just for business people, IT teams have also a significant role to play in business growth and revenue optimization.


Launching the new Monitive

It’s been a long journey since I decided that the current version of Monitive is just not good enough for our customers. That it doesn’t scale how it should. That its interface isn’t responsive or suitable for mobile devices. That the inner workings are not flexible enough to allow further extensions and features. All this, because it was the very first usable iteration of Monitive, crafted around 2011.

Extending InfluxDB with Serverless Functions

Data ingestion and data analysis are the yin and yang of a time series platform. There are many resources to help you ingest data. Typical ingestions are agent-based, imports via CSVs, using client libraries, or via third-party technologies. Once your time series data arrives, analysis completes the circle and often leads to additional data collection, and so on and so forth.

CI/CD: What is continuous integration?

Continuous integration is the first half of the acronym CI/CD, with Continuous Delivery completing the second half. In this three-part article, we look at the two halves of CI/CD to define and understand them, and then, in part three, we talk about how Uptrends fits into your CI/CD processes. Let’s get started at the beginning with continuous integration.

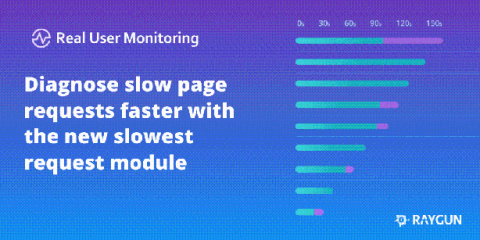
Diagnose slow page requests with the latest addition to RUM

Earlier in the year, we launched the request details page in Raygun Real User Monitoring. This update brought the instance-level insights into page performance to help you understand exactly what caused poor performance and how to improve it. To complement instance-level insights, this latest launch brings the Latest slowest requests module to Real User Monitoring. Now, when viewing performance data for a specific URI, you can easily jump into the instance-level diagnostics for a specific slow request.

Complement your network monitoring with SNMP traps

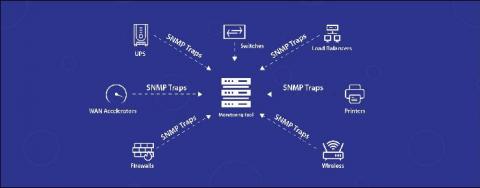
Network device monitoring with Simple Network Management Protocol (SNMP) gives you complete visibility into the health and availability of your network devices. Monitoring tools conduct periodic checks to gather device status and performance metrics. The device's status is updated only when a check is initiated by the monitoring system in the defined time interval. Any fault that happens in between polls is only captured when the next check is initiated.

Web Monitoring Dashboards | The SRE's Ultimate Multi-Tool

It’s 3 AM and you are roused out of sleep by the dull buzzing of your phone in the other room. Some sort of emergency, you conclude as you fumble with the lockscreen. There it is: an alert that the API governing user registration is acting up. When we think about the lag between time of incident and time to respond, it’s not just about how long the system went down. How long it physically takes us to respond to the problem also contributes to lost downtime.