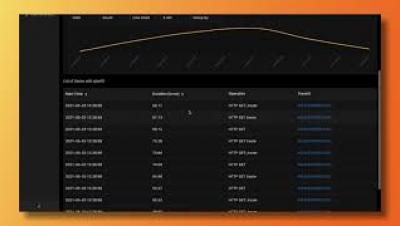
Identify high latency issues with SigNoz in 5 quick steps
This video gives a quick overview of how you can identify high latency issues in your application in 5 quick steps


The latest News and Information on Monitoring for Websites, Applications, APIs, Infrastructure, and other technologies.
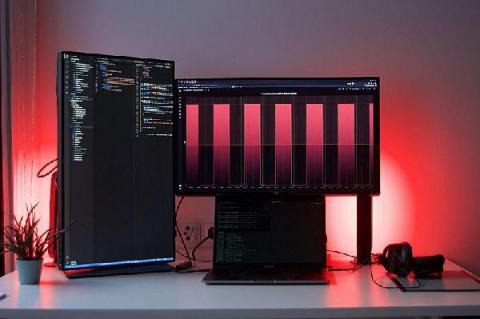
I recently got a couple of Philips Hue Play lights to spice up my home office setup, and after a bit of tinkering with the APIs, I decided it would be a fun project to create my own personal NOC room, using them to visualize the status of some system I’m monitoring.
Everyone talks about creating content. But what about controlling it? In this Dogfooding Chronicle, I’ll walk you through how we updated our Content Security Policy using Discover — and how we’re keeping watch with Dashboards.
We know that developers or operators troubleshooting applications and systems have a lot of data to sort through while getting to the root cause of issues. Often there are fields like error response codes that are critical for finding answers and resolving those issues. Today, we’re proud to announce log field analytics in Cloud Logging, a new way to search, filter and understand the structure of your logs so you can find answers faster and easier than ever before.
In this article, you will find 10 practical Prometheus query examples for monitoring your Kubernetes cluster. So you are just getting started with Prometheus, and are figuring out how to write PromQL queries. At Sysdig, we’ve got you covered! A while ago, we created a PromQL getting started guide. Now we’ll jump in skipping the theory, directly with some PromQL examples.