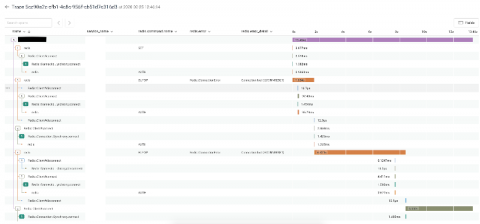
Using Honeycomb to Investigate a Redis Connection Leak
This is the story of how I used Honeycomb to troubleshoot redis/redis-rb#924 and discovered a surprising workaround.


The latest News and Information on Monitoring for Websites, Applications, APIs, Infrastructure, and other technologies.
This is the story of how I used Honeycomb to troubleshoot redis/redis-rb#924 and discovered a surprising workaround.
This post is the second in our Kubernetes observability tutorial series, where we explore how you can monitor all aspects of your applications running in Kubernetes, including: We’ll cover using Elastic Observability to ingest and analyze container metrics in Kibana using the Metrics app and out-of-the-box dashboards.
A while ago, we covered the invocation (trigger) methods supported by Lambda and the integrations available with the AWS catalog. Now we’re launching a series of articles to correlate these integration possibilities with common serverless architectural patterns (covered by this literature review). In Part I, we will cover the Orchestration & Aggregation category. Subscribe to our newsletter and stay tuned for the next parts of the series.
Digital Experience firm analyzes employee sentiment on the IT service they’re receiving IT experience management software company Nexthink is revving its efforts to help companies measure and improve how employees feel about their IT environments with a new release of its platform.
Over the past few months, many organizations have transitioned their employees from mostly onsite to fully remote work environments. Now we’re entering into a phase where roughly 30% of the workforce will soon head back to the office, while the rest continue to work from home.
As odd as it might sound, I think these past few months have done a lot of good for IT, and following the recent news from Nexthink last week, I actually feel optimistic for many enterprises out there that might be struggling. Hear me out. Right now, there are millions of people working in new, flexible work environments that didn’t even exist six months ago.
This was originally posted on The New Stack. Once upon a time, log management was relatively straightforward. The volume, types, and structures of logs were simple and manageable. However, over the past few years, all of this simplicity has gone out the window. Thanks to the shift toward cloud native technologies—such as loosely coupled services, microservices architectures, and technologies like containers and Kubernetes—the log management strategies of the past no longer suffice.
When you want to spot hosts, applications, containers, plant equipment, or sensors that are behaving differently from others, you can use the Median Absolute Deviation (MAD) algorithm to identify when a time series is “deviating from the pack”. In this tutorial, we’ll identify anomalous hosts using mad() — the Flux implementation of MAD — from a Third Party Flux Package called anaisdg/anomalydetection.
With the new normal adding several more challenges and variables to the security layer, how do you ensure your data is safeguarded without increasing the workload or the headcount of your security team? Using advanced analytics, in tandem with endpoint monitoring applications such as ManageEngine’s Mobile Device Manager Plus and Desktop Central, will help you better visualize and analyze your endpoint data, identify patterns, and establish correlations.